Immigrants from Thailand vs French Canadian College, 1 year or more

COMPARE

Immigrants from Thailand
Race
Ancestry
AfghanAfricanAlaska NativeAlaskan AthabascanAlbanianAleutAlsatianAmericanApacheArabArapahoArgentineanArmenianAssyrian/Chaldean/SyriacAustralianAustrianBahamianBangladeshiBarbadianBasqueBelgianBelizeanBermudanBhutaneseBlackfeetBolivianBrazilianBritishBritish West IndianBulgarianBurmeseCajunCambodianCanadianCape VerdeanCarpatho RusynCelticCentral AmericanCentral American IndianCherokeeCheyenneChickasawChileanChineseChippewaChoctawColombianColvilleComancheCosta RicanCreeCreekCroatianCrowCubanCypriotCzechCzechoslovakianDanishDelawareDominicanDutchDutch West IndianEastern EuropeanEcuadorianEgyptianEnglishEstonianEthiopianEuropeanFijianFilipinoFinnishFrenchFrench American IndianGermanGerman RussianGhanaianGreekGuamanian/ChamorroGuatemalanGuyaneseHaitianHmongHonduranHopiHoumaHungarianIcelanderIndian (Asian)IndonesianInupiatIranianIraqiIrishIroquoisIsraeliItalianJamaicanJapaneseJordanianKenyanKiowaKoreanLaotianLatvianLebaneseLiberianLithuanianLumbeeLuxembourgerMacedonianMalaysianMalteseMarshalleseMenomineeMexicanMexican American IndianMongolianMoroccanNative HawaiianNavajoNepaleseNew ZealanderNicaraguanNigerianNorthern EuropeanNorwegianOkinawanOsageOttawaPaiutePakistaniPalestinianPanamanianParaguayanPennsylvania GermanPeruvianPimaPolishPortuguesePotawatomiPuebloPuerto RicanPuget Sound SalishRomanianRussianSalvadoranSamoanScandinavianScotch-IrishScottishSeminoleSenegaleseSerbianShoshoneSierra LeoneanSiouxSlavicSlovakSloveneSomaliSouth AfricanSouth AmericanSouth American IndianSoviet UnionSpaniardSpanishSpanish AmericanSpanish American IndianSri LankanSubsaharan AfricanSudaneseSwedishSwissSyrianTaiwaneseThaiTlingit-HaidaTohono O'OdhamTonganTrinidadian and TobagonianTsimshianTurkishU.S. Virgin IslanderUgandanUkrainianUruguayanUteVenezuelanVietnameseWelshWest IndianYakamaYaquiYugoslavianYumanYup'ikZimbabwean
Immigration
NonimmigrantsImmigrantsAfghanistanAfricaAlbaniaArgentinaArmeniaAsiaAustraliaAustriaBahamasBangladeshBarbadosBelarusBelgiumBelizeBoliviaBosnia and HerzegovinaBrazilBulgariaBurma/MyanmarCabo VerdeCambodiaCameroonCanadaCaribbeanCentral AmericaChileChinaColombiaCongoCosta RicaCroatiaCubaCzechoslovakiaDenmarkDominicaDominican RepublicEastern AfricaEastern AsiaEastern EuropeEcuadorEgyptEl SalvadorEnglandEritreaEthiopiaEuropeFijiFranceGermanyGhanaGreeceGrenadaGuatemalaGuyanaHaitiHondurasHong KongHungaryIndiaIndonesiaIranIraqIrelandIsraelItalyJamaicaJapanJordanKazakhstanKenyaKoreaKuwaitLaosLatin AmericaLatviaLebanonLiberiaLithuaniaMalaysiaMexicoMicronesiaMiddle AfricaMoldovaMoroccoNepalNetherlandsNicaraguaNigeriaNorth AmericaNorth MacedoniaNorthern AfricaNorthern EuropeNorwayOceaniaPakistanPanamaPeruPhilippinesPolandPortugalRomaniaRussiaSaudi ArabiaScotlandSenegalSerbiaSierra LeoneSingaporeSomaliaSouth AfricaSouth AmericaSouth Central AsiaSouth Eastern AsiaSouthern EuropeSpainSri LankaSt. Vincent and the GrenadinesSudanSwedenSwitzerlandSyriaTaiwanThailandTrinidad and TobagoTurkeyUgandaUkraineUruguayUzbekistanVenezuelaVietnamWest IndiesWestern AfricaWestern AsiaWestern EuropeYemenZaireZimbabweAzores
French Canadian
Race
Ancestry
AfghanAfricanAlaska NativeAlaskan AthabascanAlbanianAleutAlsatianAmericanApacheArabArapahoArgentineanArmenianAssyrian/Chaldean/SyriacAustralianAustrianBahamianBangladeshiBarbadianBasqueBelgianBelizeanBermudanBhutaneseBlackfeetBolivianBrazilianBritishBritish West IndianBulgarianBurmeseCajunCambodianCanadianCape VerdeanCarpatho RusynCelticCentral AmericanCentral American IndianCherokeeCheyenneChickasawChileanChineseChippewaChoctawColombianColvilleComancheCosta RicanCreeCreekCroatianCrowCubanCypriotCzechCzechoslovakianDanishDelawareDominicanDutchDutch West IndianEastern EuropeanEcuadorianEgyptianEnglishEstonianEthiopianEuropeanFijianFilipinoFinnishFrenchFrench American IndianFrench CanadianGermanGerman RussianGhanaianGreekGuamanian/ChamorroGuatemalanGuyaneseHaitianHmongHonduranHopiHoumaHungarianIcelanderIndian (Asian)IndonesianInupiatIranianIraqiIrishIroquoisIsraeliItalianJamaicanJapaneseJordanianKenyanKiowaKoreanLaotianLatvianLebaneseLiberianLithuanianLumbeeLuxembourgerMacedonianMalaysianMalteseMarshalleseMenomineeMexicanMexican American IndianMongolianMoroccanNative HawaiianNavajoNepaleseNew ZealanderNicaraguanNigerianNorthern EuropeanNorwegianOkinawanOsageOttawaPaiutePakistaniPalestinianPanamanianParaguayanPennsylvania GermanPeruvianPimaPolishPortuguesePotawatomiPuebloPuerto RicanPuget Sound SalishRomanianRussianSalvadoranSamoanScandinavianScotch-IrishScottishSeminoleSenegaleseSerbianShoshoneSierra LeoneanSiouxSlavicSlovakSloveneSomaliSouth AfricanSouth AmericanSouth American IndianSoviet UnionSpaniardSpanishSpanish AmericanSpanish American IndianSri LankanSubsaharan AfricanSudaneseSwedishSwissSyrianTaiwaneseThaiTlingit-HaidaTohono O'OdhamTonganTrinidadian and TobagonianTsimshianTurkishU.S. Virgin IslanderUgandanUkrainianUruguayanUteVenezuelanVietnameseWelshWest IndianYakamaYaquiYugoslavianYumanYup'ikZimbabwean
Immigration
NonimmigrantsImmigrantsAfghanistanAfricaAlbaniaArgentinaArmeniaAsiaAustraliaAustriaBahamasBangladeshBarbadosBelarusBelgiumBelizeBoliviaBosnia and HerzegovinaBrazilBulgariaBurma/MyanmarCabo VerdeCambodiaCameroonCanadaCaribbeanCentral AmericaChileChinaColombiaCongoCosta RicaCroatiaCubaCzechoslovakiaDenmarkDominicaDominican RepublicEastern AfricaEastern AsiaEastern EuropeEcuadorEgyptEl SalvadorEnglandEritreaEthiopiaEuropeFijiFranceGermanyGhanaGreeceGrenadaGuatemalaGuyanaHaitiHondurasHong KongHungaryIndiaIndonesiaIranIraqIrelandIsraelItalyJamaicaJapanJordanKazakhstanKenyaKoreaKuwaitLaosLatin AmericaLatviaLebanonLiberiaLithuaniaMalaysiaMexicoMicronesiaMiddle AfricaMoldovaMoroccoNepalNetherlandsNicaraguaNigeriaNorth AmericaNorth MacedoniaNorthern AfricaNorthern EuropeNorwayOceaniaPakistanPanamaPeruPhilippinesPolandPortugalRomaniaRussiaSaudi ArabiaScotlandSenegalSerbiaSierra LeoneSingaporeSomaliaSouth AfricaSouth AmericaSouth Central AsiaSouth Eastern AsiaSouthern EuropeSpainSri LankaSt. Vincent and the GrenadinesSudanSwedenSwitzerlandSyriaTaiwanTrinidad and TobagoTurkeyUgandaUkraineUruguayUzbekistanVenezuelaVietnamWest IndiesWestern AfricaWestern AsiaWestern EuropeYemenZaireZimbabweAzores
College, 1 year or more
Income
Poverty
Unemployment
Labor Participation
Family Structure
Vehicle Availability
Education Level
Disability

College, 1 year or more Comparison

Immigrants from Thailand

French Canadians

Fair
Poor
58.6%
COLLEGE, 1 YEAR OR MORE
26.0/ 100
METRIC RATING
197th/ 347
METRIC RANK
57.8%
COLLEGE, 1 YEAR OR MORE
11.8/ 100
METRIC RATING
213th/ 347
METRIC RANK

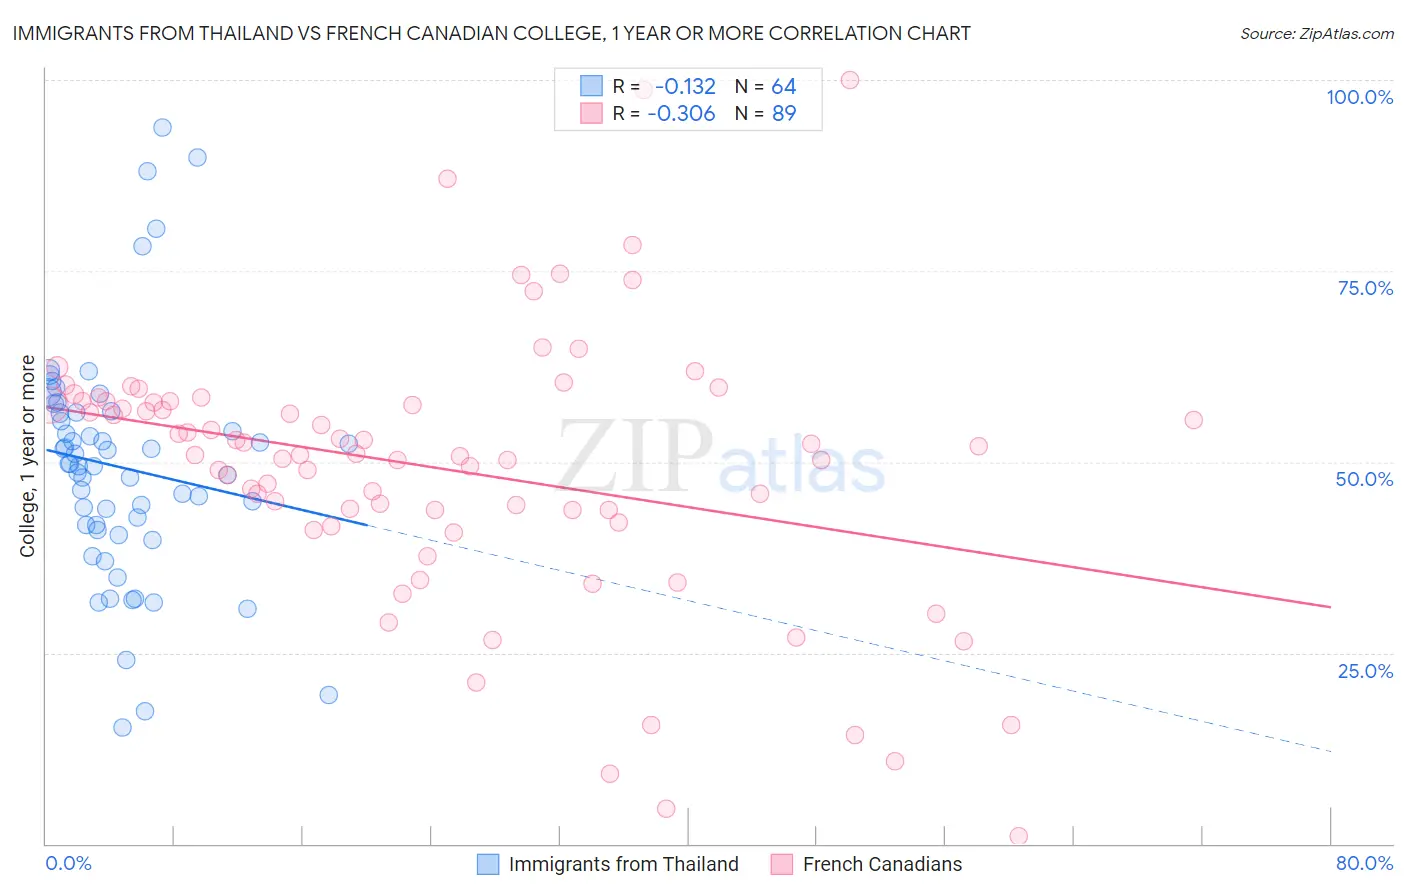
Immigrants from Thailand vs French Canadian College, 1 year or more Correlation Chart

The statistical analysis conducted on geographies consisting of 317,023,435 people shows a poor negative correlation between the proportion of Immigrants from Thailand and percentage of population with at least college, 1 year or more education in the United States with a correlation coefficient (R) of -0.132 and weighted average of 58.6%. Similarly, the statistical analysis conducted on geographies consisting of 502,674,122 people shows a mild negative correlation between the proportion of French Canadians and percentage of population with at least college, 1 year or more education in the United States with a correlation coefficient (R) of -0.306 and weighted average of 57.8%, a difference of 1.3%.
Immigrants from Thailand vs French Canadian College, 1 year or more

College, 1 year or more Correlation Summary

MeasurementImmigrants from ThailandFrench Canadian
Minimum15.2%0.95%
Maximum93.8%100.0%
Range78.6%99.0%
Mean49.3%49.1%
Median49.6%51.0%
Interquartile 25% (IQ1)41.4%42.9%
Interquartile 75% (IQ3)56.5%57.9%
Interquartile Range (IQR)15.1%15.0%
Standard Deviation (Sample)15.4%17.8%
Standard Deviation (Population)15.3%17.7%

Demographics Similar to Immigrants from Thailand and French Canadians by College, 1 year or more

In terms of college, 1 year or more, the demographic groups most similar to Immigrants from Thailand are Dutch (58.6%, a difference of 0.010%), Guamanian/Chamorro (58.6%, a difference of 0.010%), Immigrants from South Eastern Asia (58.5%, a difference of 0.070%), Slovak (58.5%, a difference of 0.10%), and Spanish (58.5%, a difference of 0.13%). Similarly, the demographic groups most similar to French Canadians are Immigrants from Senegal (57.8%, a difference of 0.0%), Immigrants from Colombia (57.8%, a difference of 0.030%), Tongan (57.8%, a difference of 0.040%), Immigrants from Nigeria (57.9%, a difference of 0.18%), and Tsimshian (57.9%, a difference of 0.20%).
DemographicsRating | RankCollege, 1 year or more
Dutch
26.2
/100
|
#195
Fair
58.6%
Guamanians/Chamorros
26.2
/100
|
#196
Fair
58.6%
Immigrants | Thailand
26.0
/100
|
#197
Fair
58.6%
Immigrants | South Eastern Asia
25.1
/100
|
#198
Fair
58.5%
Slovaks
24.6
/100
|
#199
Fair
58.5%
Spanish
24.2
/100
|
#200
Fair
58.5%
Nigerians
23.0
/100
|
#201
Fair
58.5%
Immigrants | South America
21.9
/100
|
#202
Fair
58.4%
Ghanaians
20.9
/100
|
#203
Fair
58.4%
Panamanians
19.2
/100
|
#204
Poor
58.3%
Immigrants | Zaire
18.7
/100
|
#205
Poor
58.3%
Immigrants | Vietnam
18.2
/100
|
#206
Poor
58.2%
Senegalese
16.9
/100
|
#207
Poor
58.2%
Immigrants | Uruguay
15.2
/100
|
#208
Poor
58.1%
Immigrants | Middle Africa
14.0
/100
|
#209
Poor
58.0%
Tsimshian
13.5
/100
|
#210
Poor
57.9%
Immigrants | Nigeria
13.3
/100
|
#211
Poor
57.9%
Immigrants | Senegal
11.8
/100
|
#212
Poor
57.8%
French Canadians
11.8
/100
|
#213
Poor
57.8%
Immigrants | Colombia
11.6
/100
|
#214
Poor
57.8%
Tongans
11.6
/100
|
#215
Poor
57.8%