Immigrants from Thailand vs Hawaiian College, 1 year or more
COMPARE
Immigrants from Thailand
Hawaiian
College, 1 year or more
College, 1 year or more Comparison
Immigrants from Thailand
Hawaiians
58.6%
COLLEGE, 1 YEAR OR MORE
26.0/ 100
METRIC RATING
197th/ 347
METRIC RANK
55.6%
COLLEGE, 1 YEAR OR MORE
0.8/ 100
METRIC RATING
247th/ 347
METRIC RANK
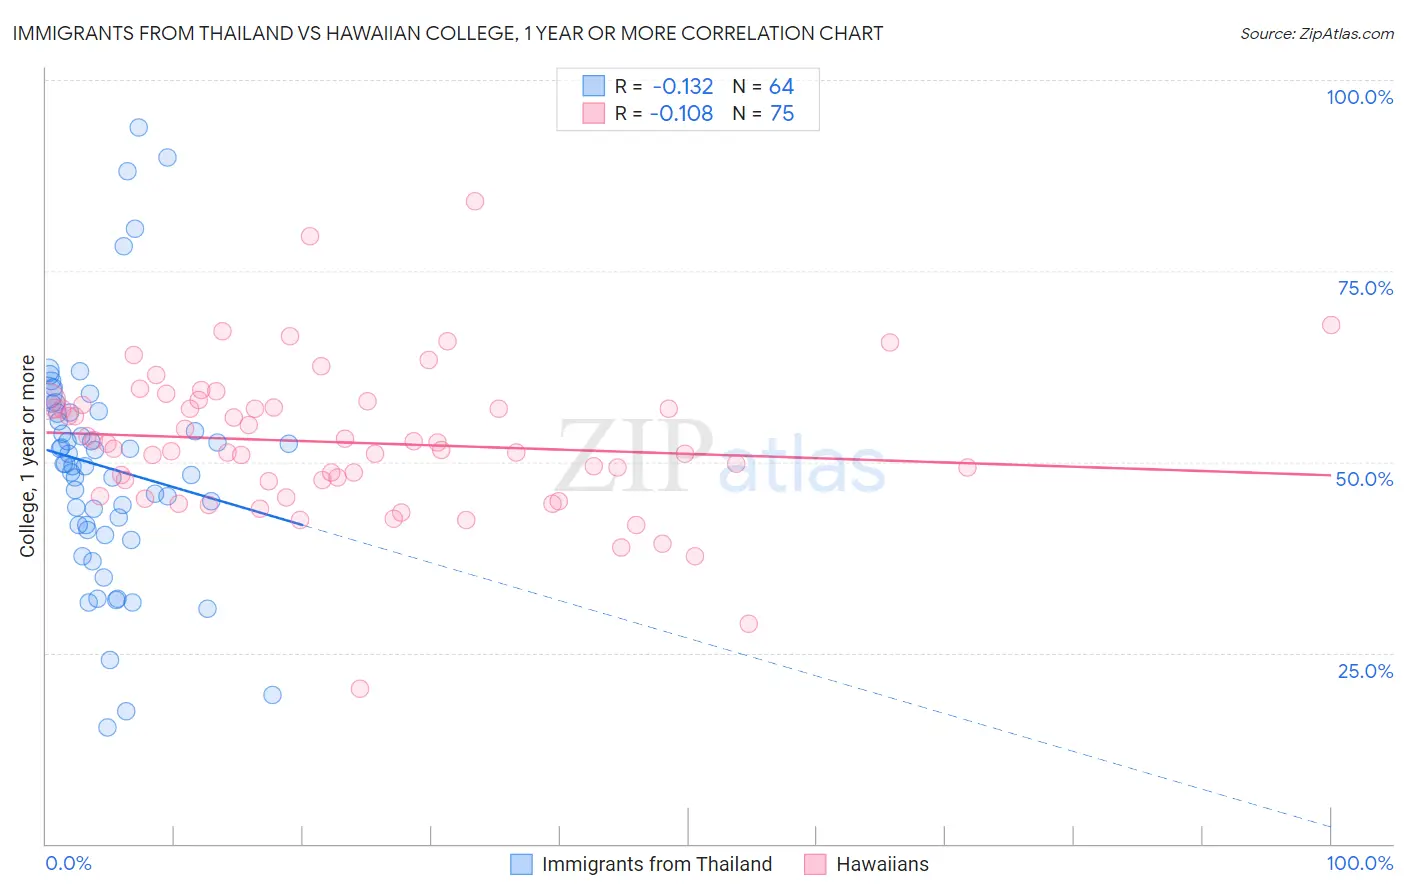
Immigrants from Thailand vs Hawaiian College, 1 year or more Correlation Chart
The statistical analysis conducted on geographies consisting of 317,023,435 people shows a poor negative correlation between the proportion of Immigrants from Thailand and percentage of population with at least college, 1 year or more education in the United States with a correlation coefficient (R) of -0.132 and weighted average of 58.6%. Similarly, the statistical analysis conducted on geographies consisting of 327,619,549 people shows a poor negative correlation between the proportion of Hawaiians and percentage of population with at least college, 1 year or more education in the United States with a correlation coefficient (R) of -0.108 and weighted average of 55.6%, a difference of 5.4%.
College, 1 year or more Correlation Summary
| Measurement | Immigrants from Thailand | Hawaiian |
| Minimum | 15.2% | 20.3% |
| Maximum | 93.8% | 84.1% |
| Range | 78.6% | 63.8% |
| Mean | 49.3% | 52.5% |
| Median | 49.6% | 51.7% |
| Interquartile 25% (IQ1) | 41.4% | 47.5% |
| Interquartile 75% (IQ3) | 56.5% | 57.4% |
| Interquartile Range (IQR) | 15.1% | 9.9% |
| Standard Deviation (Sample) | 15.4% | 9.7% |
| Standard Deviation (Population) | 15.3% | 9.7% |
Similar Demographics by College, 1 year or more
Demographics Similar to Immigrants from Thailand by College, 1 year or more
In terms of college, 1 year or more, the demographic groups most similar to Immigrants from Thailand are Dutch (58.6%, a difference of 0.010%), Guamanian/Chamorro (58.6%, a difference of 0.010%), Costa Rican (58.6%, a difference of 0.030%), Immigrants from South Eastern Asia (58.5%, a difference of 0.070%), and Peruvian (58.6%, a difference of 0.10%).
| Demographics | Rating | Rank | College, 1 year or more |
| Immigrants | Cameroon | 31.2 /100 | #190 | Fair 58.8% |
| Immigrants | Philippines | 29.2 /100 | #191 | Fair 58.7% |
| Colombians | 27.6 /100 | #192 | Fair 58.7% |
| Peruvians | 27.5 /100 | #193 | Fair 58.6% |
| Costa Ricans | 26.4 /100 | #194 | Fair 58.6% |
| Dutch | 26.2 /100 | #195 | Fair 58.6% |
| Guamanians/Chamorros | 26.2 /100 | #196 | Fair 58.6% |
| Immigrants | Thailand | 26.0 /100 | #197 | Fair 58.6% |
| Immigrants | South Eastern Asia | 25.1 /100 | #198 | Fair 58.5% |
| Slovaks | 24.6 /100 | #199 | Fair 58.5% |
| Spanish | 24.2 /100 | #200 | Fair 58.5% |
| Nigerians | 23.0 /100 | #201 | Fair 58.5% |
| Immigrants | South America | 21.9 /100 | #202 | Fair 58.4% |
| Ghanaians | 20.9 /100 | #203 | Fair 58.4% |
| Panamanians | 19.2 /100 | #204 | Poor 58.3% |
Demographics Similar to Hawaiians by College, 1 year or more
In terms of college, 1 year or more, the demographic groups most similar to Hawaiians are Immigrants from Congo (55.6%, a difference of 0.040%), Malaysian (55.6%, a difference of 0.070%), Immigrants from Liberia (55.7%, a difference of 0.12%), Immigrants from Trinidad and Tobago (55.5%, a difference of 0.13%), and Delaware (55.5%, a difference of 0.16%).
| Demographics | Rating | Rank | College, 1 year or more |
| Trinidadians and Tobagonians | 1.1 /100 | #240 | Tragic 55.8% |
| French American Indians | 1.0 /100 | #241 | Tragic 55.8% |
| Marshallese | 1.0 /100 | #242 | Tragic 55.8% |
| Osage | 1.0 /100 | #243 | Tragic 55.8% |
| Chippewa | 0.9 /100 | #244 | Tragic 55.7% |
| Immigrants | Liberia | 0.8 /100 | #245 | Tragic 55.7% |
| Malaysians | 0.8 /100 | #246 | Tragic 55.6% |
| Hawaiians | 0.8 /100 | #247 | Tragic 55.6% |
| Immigrants | Congo | 0.8 /100 | #248 | Tragic 55.6% |
| Immigrants | Trinidad and Tobago | 0.7 /100 | #249 | Tragic 55.5% |
| Delaware | 0.7 /100 | #250 | Tragic 55.5% |
| Immigrants | Cambodia | 0.6 /100 | #251 | Tragic 55.4% |
| Aleuts | 0.6 /100 | #252 | Tragic 55.4% |
| Immigrants | Barbados | 0.6 /100 | #253 | Tragic 55.4% |
| Japanese | 0.5 /100 | #254 | Tragic 55.2% |