Immigrants from Taiwan vs Nigerian Master's Degree
COMPARE
Immigrants from Taiwan
Nigerian
Master's Degree
Master's Degree Comparison
Immigrants from Taiwan
Nigerians
22.5%
MASTER'S DEGREE
100.0/ 100
METRIC RATING
5th/ 347
METRIC RANK
14.9%
MASTER'S DEGREE
48.6/ 100
METRIC RATING
176th/ 347
METRIC RANK
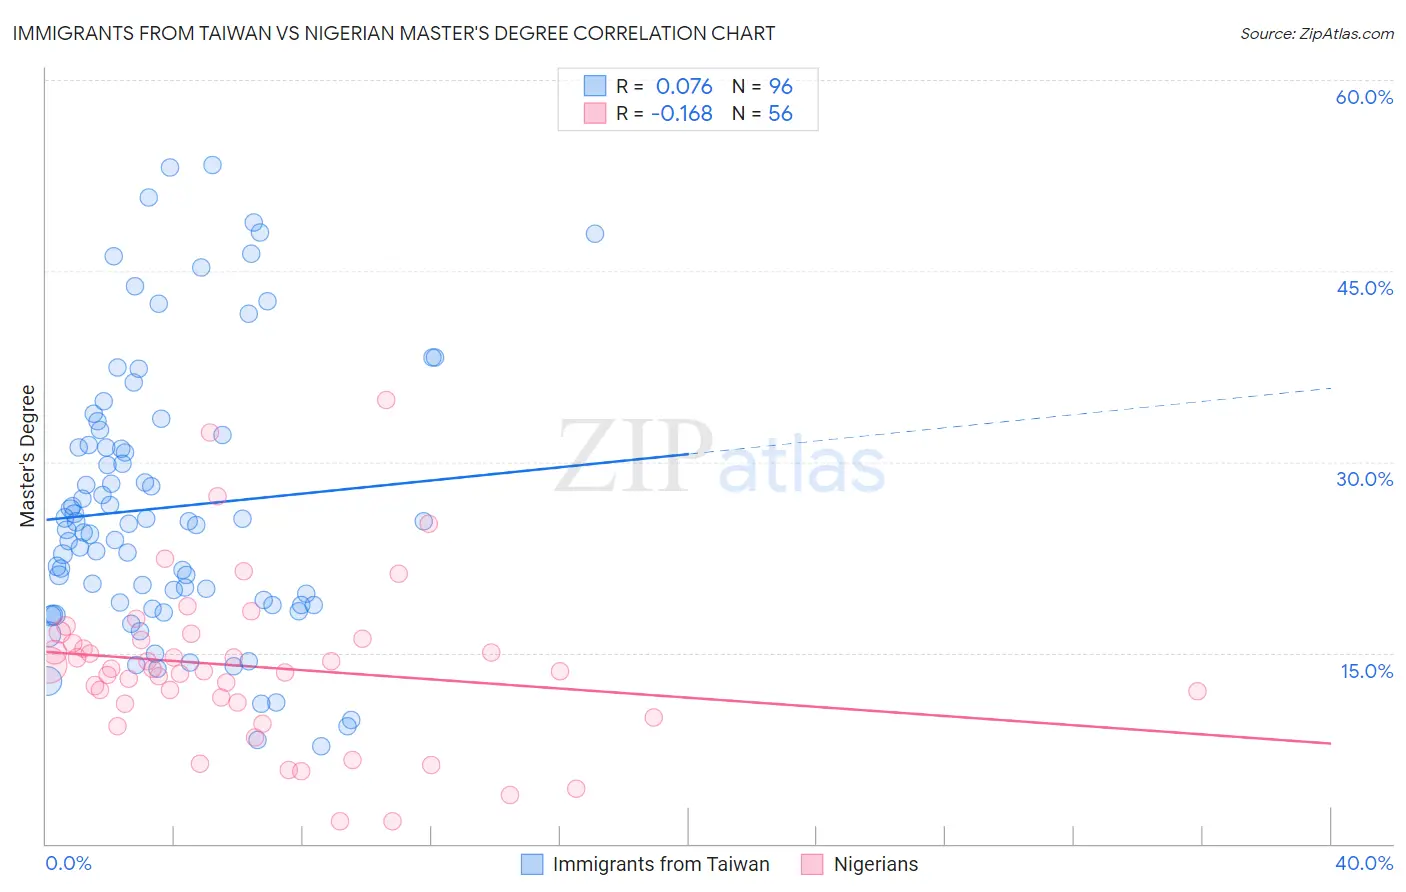
Immigrants from Taiwan vs Nigerian Master's Degree Correlation Chart
The statistical analysis conducted on geographies consisting of 298,228,086 people shows a slight positive correlation between the proportion of Immigrants from Taiwan and percentage of population with at least master's degree education in the United States with a correlation coefficient (R) of 0.076 and weighted average of 22.5%. Similarly, the statistical analysis conducted on geographies consisting of 332,630,518 people shows a poor negative correlation between the proportion of Nigerians and percentage of population with at least master's degree education in the United States with a correlation coefficient (R) of -0.168 and weighted average of 14.9%, a difference of 50.8%.
Master's Degree Correlation Summary
| Measurement | Immigrants from Taiwan | Nigerian |
| Minimum | 7.7% | 1.8% |
| Maximum | 53.3% | 34.9% |
| Range | 45.6% | 33.2% |
| Mean | 26.4% | 13.9% |
| Median | 25.1% | 13.7% |
| Interquartile 25% (IQ1) | 18.8% | 11.0% |
| Interquartile 75% (IQ3) | 31.7% | 16.1% |
| Interquartile Range (IQR) | 13.0% | 5.0% |
| Standard Deviation (Sample) | 10.7% | 6.5% |
| Standard Deviation (Population) | 10.7% | 6.4% |
Similar Demographics by Master's Degree
Demographics Similar to Immigrants from Taiwan by Master's Degree
In terms of master's degree, the demographic groups most similar to Immigrants from Taiwan are Immigrants from India (22.3%, a difference of 0.68%), Immigrants from Israel (22.6%, a difference of 0.80%), Okinawan (22.6%, a difference of 0.80%), Iranian (22.3%, a difference of 0.88%), and Cypriot (21.8%, a difference of 3.1%).
| Demographics | Rating | Rank | Master's Degree |
| Immigrants | Singapore | 100.0 /100 | #1 | Exceptional 23.4% |
| Filipinos | 100.0 /100 | #2 | Exceptional 23.4% |
| Immigrants | Israel | 100.0 /100 | #3 | Exceptional 22.6% |
| Okinawans | 100.0 /100 | #4 | Exceptional 22.6% |
| Immigrants | Taiwan | 100.0 /100 | #5 | Exceptional 22.5% |
| Immigrants | India | 100.0 /100 | #6 | Exceptional 22.3% |
| Iranians | 100.0 /100 | #7 | Exceptional 22.3% |
| Cypriots | 100.0 /100 | #8 | Exceptional 21.8% |
| Thais | 100.0 /100 | #9 | Exceptional 21.7% |
| Immigrants | Iran | 100.0 /100 | #10 | Exceptional 21.6% |
| Immigrants | China | 100.0 /100 | #11 | Exceptional 21.2% |
| Eastern Europeans | 100.0 /100 | #12 | Exceptional 21.1% |
| Immigrants | Australia | 100.0 /100 | #13 | Exceptional 20.9% |
| Immigrants | Switzerland | 100.0 /100 | #14 | Exceptional 20.9% |
| Immigrants | Eastern Asia | 100.0 /100 | #15 | Exceptional 20.8% |
Demographics Similar to Nigerians by Master's Degree
In terms of master's degree, the demographic groups most similar to Nigerians are Immigrants from Colombia (14.9%, a difference of 0.030%), Immigrants from Peru (14.9%, a difference of 0.14%), Slovak (14.9%, a difference of 0.18%), English (14.8%, a difference of 0.47%), and Costa Rican (15.0%, a difference of 0.50%).
| Demographics | Rating | Rank | Master's Degree |
| Scottish | 62.7 /100 | #169 | Good 15.2% |
| Irish | 56.3 /100 | #170 | Average 15.0% |
| Immigrants | Ghana | 53.6 /100 | #171 | Average 15.0% |
| Immigrants | Uruguay | 52.8 /100 | #172 | Average 15.0% |
| Costa Ricans | 52.5 /100 | #173 | Average 15.0% |
| Slovaks | 50.0 /100 | #174 | Average 14.9% |
| Immigrants | Peru | 49.6 /100 | #175 | Average 14.9% |
| Nigerians | 48.6 /100 | #176 | Average 14.9% |
| Immigrants | Colombia | 48.3 /100 | #177 | Average 14.9% |
| English | 45.0 /100 | #178 | Average 14.8% |
| Immigrants | Iraq | 41.3 /100 | #179 | Average 14.8% |
| Celtics | 41.3 /100 | #180 | Average 14.8% |
| Swiss | 41.1 /100 | #181 | Average 14.7% |
| Czechs | 40.4 /100 | #182 | Average 14.7% |
| Sri Lankans | 39.6 /100 | #183 | Fair 14.7% |