Immigrants from Taiwan vs Indonesian Master's Degree
COMPARE
Immigrants from Taiwan
Indonesian
Master's Degree
Master's Degree Comparison
Immigrants from Taiwan
Indonesians
22.5%
MASTER'S DEGREE
100.0/ 100
METRIC RATING
5th/ 347
METRIC RANK
12.6%
MASTER'S DEGREE
0.8/ 100
METRIC RATING
254th/ 347
METRIC RANK
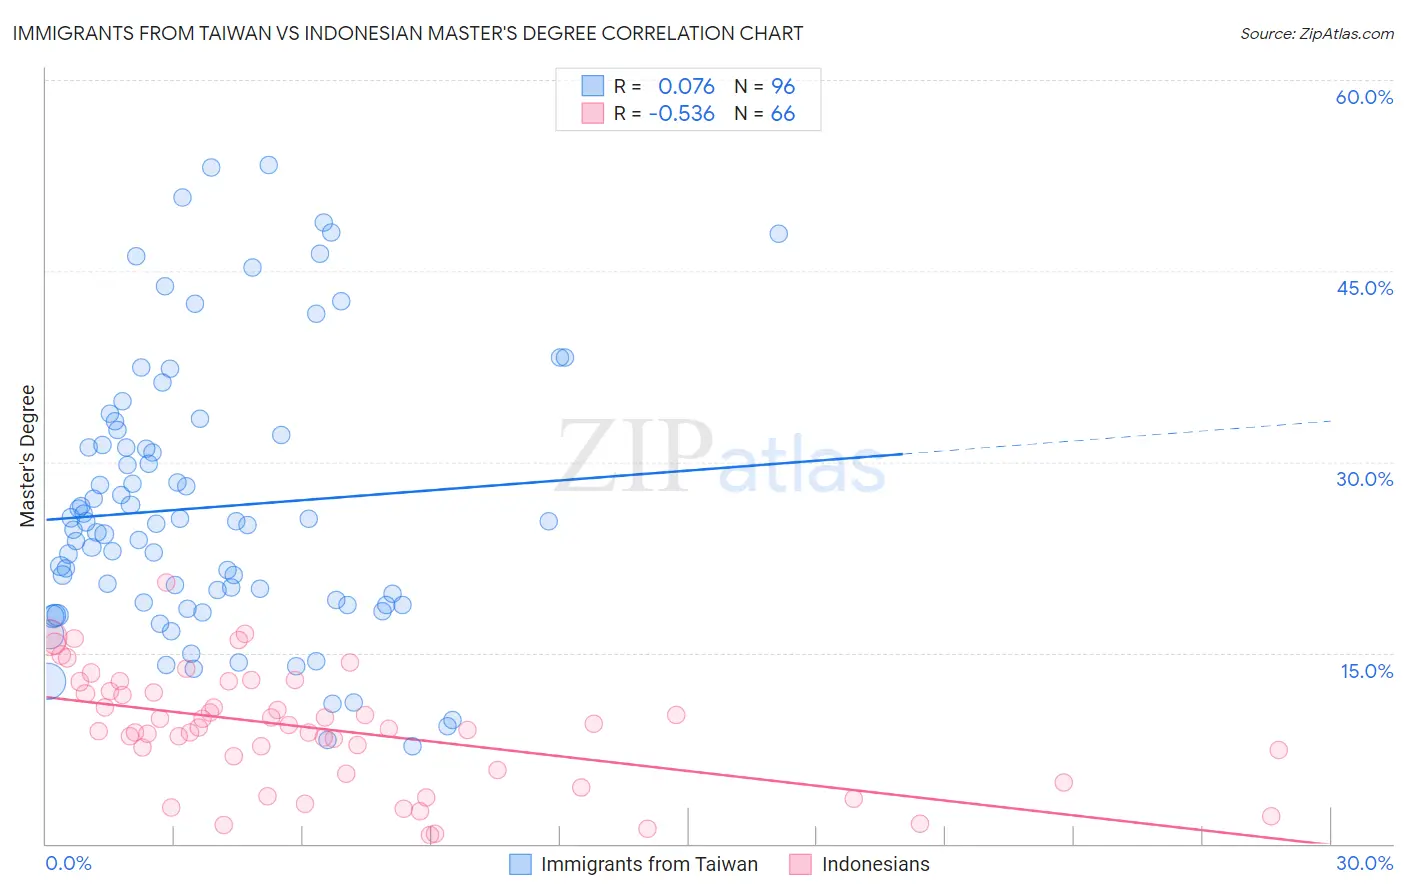
Immigrants from Taiwan vs Indonesian Master's Degree Correlation Chart
The statistical analysis conducted on geographies consisting of 298,228,086 people shows a slight positive correlation between the proportion of Immigrants from Taiwan and percentage of population with at least master's degree education in the United States with a correlation coefficient (R) of 0.076 and weighted average of 22.5%. Similarly, the statistical analysis conducted on geographies consisting of 162,683,537 people shows a substantial negative correlation between the proportion of Indonesians and percentage of population with at least master's degree education in the United States with a correlation coefficient (R) of -0.536 and weighted average of 12.6%, a difference of 77.7%.
Master's Degree Correlation Summary
| Measurement | Immigrants from Taiwan | Indonesian |
| Minimum | 7.7% | 0.73% |
| Maximum | 53.3% | 20.6% |
| Range | 45.6% | 19.8% |
| Mean | 26.4% | 9.0% |
| Median | 25.1% | 9.1% |
| Interquartile 25% (IQ1) | 18.8% | 5.8% |
| Interquartile 75% (IQ3) | 31.7% | 12.0% |
| Interquartile Range (IQR) | 13.0% | 6.2% |
| Standard Deviation (Sample) | 10.7% | 4.5% |
| Standard Deviation (Population) | 10.7% | 4.5% |
Similar Demographics by Master's Degree
Demographics Similar to Immigrants from Taiwan by Master's Degree
In terms of master's degree, the demographic groups most similar to Immigrants from Taiwan are Immigrants from India (22.3%, a difference of 0.68%), Immigrants from Israel (22.6%, a difference of 0.80%), Okinawan (22.6%, a difference of 0.80%), Iranian (22.3%, a difference of 0.88%), and Cypriot (21.8%, a difference of 3.1%).
| Demographics | Rating | Rank | Master's Degree |
| Immigrants | Singapore | 100.0 /100 | #1 | Exceptional 23.4% |
| Filipinos | 100.0 /100 | #2 | Exceptional 23.4% |
| Immigrants | Israel | 100.0 /100 | #3 | Exceptional 22.6% |
| Okinawans | 100.0 /100 | #4 | Exceptional 22.6% |
| Immigrants | Taiwan | 100.0 /100 | #5 | Exceptional 22.5% |
| Immigrants | India | 100.0 /100 | #6 | Exceptional 22.3% |
| Iranians | 100.0 /100 | #7 | Exceptional 22.3% |
| Cypriots | 100.0 /100 | #8 | Exceptional 21.8% |
| Thais | 100.0 /100 | #9 | Exceptional 21.7% |
| Immigrants | Iran | 100.0 /100 | #10 | Exceptional 21.6% |
| Immigrants | China | 100.0 /100 | #11 | Exceptional 21.2% |
| Eastern Europeans | 100.0 /100 | #12 | Exceptional 21.1% |
| Immigrants | Australia | 100.0 /100 | #13 | Exceptional 20.9% |
| Immigrants | Switzerland | 100.0 /100 | #14 | Exceptional 20.9% |
| Immigrants | Eastern Asia | 100.0 /100 | #15 | Exceptional 20.8% |
Demographics Similar to Indonesians by Master's Degree
In terms of master's degree, the demographic groups most similar to Indonesians are Immigrants from Congo (12.6%, a difference of 0.030%), Immigrants from Dominica (12.6%, a difference of 0.040%), Immigrants from Portugal (12.6%, a difference of 0.10%), Osage (12.6%, a difference of 0.58%), and French American Indian (12.7%, a difference of 0.59%).
| Demographics | Rating | Rank | Master's Degree |
| Iroquois | 1.4 /100 | #247 | Tragic 12.9% |
| Africans | 1.4 /100 | #248 | Tragic 12.9% |
| Cree | 1.3 /100 | #249 | Tragic 12.8% |
| Liberians | 1.3 /100 | #250 | Tragic 12.8% |
| Tlingit-Haida | 1.3 /100 | #251 | Tragic 12.8% |
| French American Indians | 1.0 /100 | #252 | Tragic 12.7% |
| Immigrants | Dominica | 0.8 /100 | #253 | Tragic 12.6% |
| Indonesians | 0.8 /100 | #254 | Tragic 12.6% |
| Immigrants | Congo | 0.8 /100 | #255 | Tragic 12.6% |
| Immigrants | Portugal | 0.8 /100 | #256 | Tragic 12.6% |
| Osage | 0.7 /100 | #257 | Tragic 12.6% |
| Immigrants | Liberia | 0.6 /100 | #258 | Tragic 12.5% |
| Japanese | 0.6 /100 | #259 | Tragic 12.5% |
| Dominicans | 0.6 /100 | #260 | Tragic 12.5% |
| Tongans | 0.6 /100 | #261 | Tragic 12.5% |