Immigrants from Taiwan vs Thai College, 1 year or more
COMPARE
Immigrants from Taiwan
Thai
College, 1 year or more
College, 1 year or more Comparison
Immigrants from Taiwan
Thais
69.6%
COLLEGE, 1 YEAR OR MORE
100.0/ 100
METRIC RATING
4th/ 347
METRIC RANK
68.6%
COLLEGE, 1 YEAR OR MORE
100.0/ 100
METRIC RATING
8th/ 347
METRIC RANK
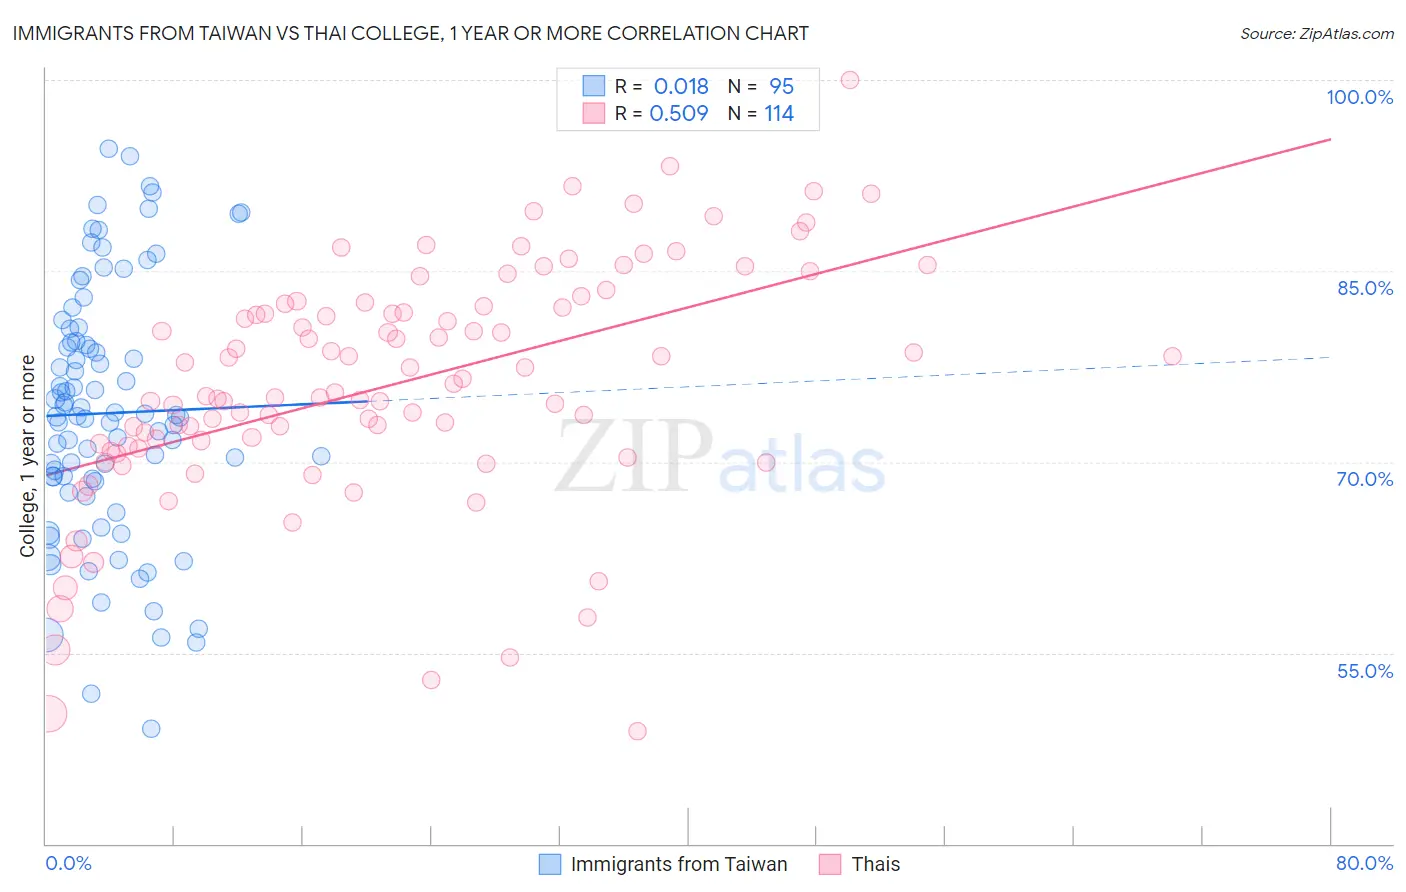
Immigrants from Taiwan vs Thai College, 1 year or more Correlation Chart
The statistical analysis conducted on geographies consisting of 298,289,229 people shows no correlation between the proportion of Immigrants from Taiwan and percentage of population with at least college, 1 year or more education in the United States with a correlation coefficient (R) of 0.018 and weighted average of 69.6%. Similarly, the statistical analysis conducted on geographies consisting of 475,810,448 people shows a substantial positive correlation between the proportion of Thais and percentage of population with at least college, 1 year or more education in the United States with a correlation coefficient (R) of 0.509 and weighted average of 68.6%, a difference of 1.5%.
College, 1 year or more Correlation Summary
| Measurement | Immigrants from Taiwan | Thai |
| Minimum | 49.1% | 48.8% |
| Maximum | 94.6% | 100.0% |
| Range | 45.6% | 51.2% |
| Mean | 73.8% | 76.1% |
| Median | 73.6% | 75.8% |
| Interquartile 25% (IQ1) | 68.5% | 71.2% |
| Interquartile 75% (IQ3) | 79.5% | 82.3% |
| Interquartile Range (IQR) | 11.1% | 11.0% |
| Standard Deviation (Sample) | 9.9% | 9.4% |
| Standard Deviation (Population) | 9.9% | 9.3% |
Demographics Similar to Immigrants from Taiwan and Thais by College, 1 year or more
In terms of college, 1 year or more, the demographic groups most similar to Immigrants from Taiwan are Immigrants from India (69.6%, a difference of 0.0%), Immigrants from Iran (69.5%, a difference of 0.20%), Iranian (70.0%, a difference of 0.49%), Immigrants from Singapore (70.1%, a difference of 0.72%), and Okinawan (69.0%, a difference of 0.97%). Similarly, the demographic groups most similar to Thais are Okinawan (69.0%, a difference of 0.54%), Immigrants from Israel (67.8%, a difference of 1.2%), Immigrants from Iran (69.5%, a difference of 1.3%), Immigrants from Australia (67.7%, a difference of 1.4%), and Immigrants from India (69.6%, a difference of 1.5%).
| Demographics | Rating | Rank | College, 1 year or more |
| Filipinos | 100.0 /100 | #1 | Exceptional 71.0% |
| Immigrants | Singapore | 100.0 /100 | #2 | Exceptional 70.1% |
| Iranians | 100.0 /100 | #3 | Exceptional 70.0% |
| Immigrants | Taiwan | 100.0 /100 | #4 | Exceptional 69.6% |
| Immigrants | India | 100.0 /100 | #5 | Exceptional 69.6% |
| Immigrants | Iran | 100.0 /100 | #6 | Exceptional 69.5% |
| Okinawans | 100.0 /100 | #7 | Exceptional 69.0% |
| Thais | 100.0 /100 | #8 | Exceptional 68.6% |
| Immigrants | Israel | 100.0 /100 | #9 | Exceptional 67.8% |
| Immigrants | Australia | 100.0 /100 | #10 | Exceptional 67.7% |
| Immigrants | South Central Asia | 100.0 /100 | #11 | Exceptional 67.1% |
| Cypriots | 100.0 /100 | #12 | Exceptional 67.0% |
| Immigrants | Sweden | 100.0 /100 | #13 | Exceptional 66.8% |
| Burmese | 100.0 /100 | #14 | Exceptional 66.7% |
| Cambodians | 100.0 /100 | #15 | Exceptional 66.7% |
| Immigrants | Japan | 100.0 /100 | #16 | Exceptional 66.7% |
| Immigrants | Eastern Asia | 100.0 /100 | #17 | Exceptional 66.6% |
| Eastern Europeans | 100.0 /100 | #18 | Exceptional 66.6% |
| Immigrants | Switzerland | 100.0 /100 | #19 | Exceptional 66.5% |
| Immigrants | Korea | 100.0 /100 | #20 | Exceptional 66.5% |