Immigrants from Taiwan vs Cuban College, 1 year or more
COMPARE
Immigrants from Taiwan
Cuban
College, 1 year or more
College, 1 year or more Comparison
Immigrants from Taiwan
Cubans
69.6%
COLLEGE, 1 YEAR OR MORE
100.0/ 100
METRIC RATING
4th/ 347
METRIC RANK
53.4%
COLLEGE, 1 YEAR OR MORE
0.0/ 100
METRIC RATING
291st/ 347
METRIC RANK
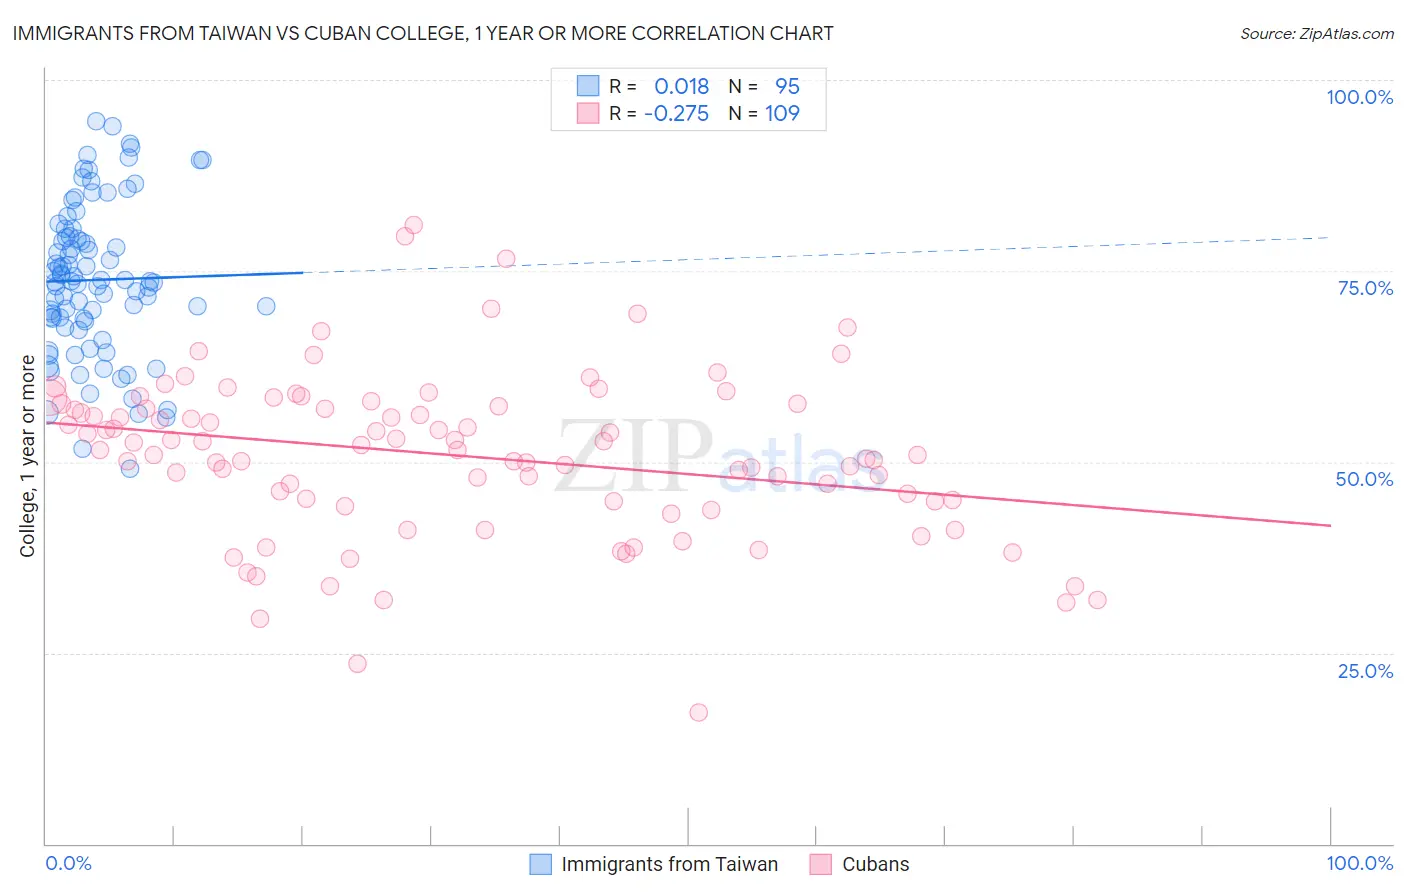
Immigrants from Taiwan vs Cuban College, 1 year or more Correlation Chart
The statistical analysis conducted on geographies consisting of 298,289,229 people shows no correlation between the proportion of Immigrants from Taiwan and percentage of population with at least college, 1 year or more education in the United States with a correlation coefficient (R) of 0.018 and weighted average of 69.6%. Similarly, the statistical analysis conducted on geographies consisting of 449,372,622 people shows a weak negative correlation between the proportion of Cubans and percentage of population with at least college, 1 year or more education in the United States with a correlation coefficient (R) of -0.275 and weighted average of 53.4%, a difference of 30.5%.
College, 1 year or more Correlation Summary
| Measurement | Immigrants from Taiwan | Cuban |
| Minimum | 49.1% | 17.3% |
| Maximum | 94.6% | 81.0% |
| Range | 45.6% | 63.7% |
| Mean | 73.8% | 50.8% |
| Median | 73.6% | 51.5% |
| Interquartile 25% (IQ1) | 68.5% | 44.8% |
| Interquartile 75% (IQ3) | 79.5% | 57.4% |
| Interquartile Range (IQR) | 11.1% | 12.6% |
| Standard Deviation (Sample) | 9.9% | 10.8% |
| Standard Deviation (Population) | 9.9% | 10.8% |
Similar Demographics by College, 1 year or more
Demographics Similar to Immigrants from Taiwan by College, 1 year or more
In terms of college, 1 year or more, the demographic groups most similar to Immigrants from Taiwan are Immigrants from India (69.6%, a difference of 0.0%), Immigrants from Iran (69.5%, a difference of 0.20%), Iranian (70.0%, a difference of 0.49%), Immigrants from Singapore (70.1%, a difference of 0.72%), and Okinawan (69.0%, a difference of 0.97%).
| Demographics | Rating | Rank | College, 1 year or more |
| Filipinos | 100.0 /100 | #1 | Exceptional 71.0% |
| Immigrants | Singapore | 100.0 /100 | #2 | Exceptional 70.1% |
| Iranians | 100.0 /100 | #3 | Exceptional 70.0% |
| Immigrants | Taiwan | 100.0 /100 | #4 | Exceptional 69.6% |
| Immigrants | India | 100.0 /100 | #5 | Exceptional 69.6% |
| Immigrants | Iran | 100.0 /100 | #6 | Exceptional 69.5% |
| Okinawans | 100.0 /100 | #7 | Exceptional 69.0% |
| Thais | 100.0 /100 | #8 | Exceptional 68.6% |
| Immigrants | Israel | 100.0 /100 | #9 | Exceptional 67.8% |
| Immigrants | Australia | 100.0 /100 | #10 | Exceptional 67.7% |
| Immigrants | South Central Asia | 100.0 /100 | #11 | Exceptional 67.1% |
| Cypriots | 100.0 /100 | #12 | Exceptional 67.0% |
| Immigrants | Sweden | 100.0 /100 | #13 | Exceptional 66.8% |
| Burmese | 100.0 /100 | #14 | Exceptional 66.7% |
| Cambodians | 100.0 /100 | #15 | Exceptional 66.7% |
Demographics Similar to Cubans by College, 1 year or more
In terms of college, 1 year or more, the demographic groups most similar to Cubans are Alaskan Athabascan (53.4%, a difference of 0.050%), Alaska Native (53.4%, a difference of 0.070%), Immigrants from Ecuador (53.4%, a difference of 0.070%), Chickasaw (53.3%, a difference of 0.13%), and Black/African American (53.3%, a difference of 0.15%).
| Demographics | Rating | Rank | College, 1 year or more |
| Ute | 0.1 /100 | #284 | Tragic 53.8% |
| Immigrants | Guyana | 0.1 /100 | #285 | Tragic 53.5% |
| Central American Indians | 0.1 /100 | #286 | Tragic 53.5% |
| Immigrants | Belize | 0.1 /100 | #287 | Tragic 53.5% |
| Alaska Natives | 0.0 /100 | #288 | Tragic 53.4% |
| Immigrants | Ecuador | 0.0 /100 | #289 | Tragic 53.4% |
| Alaskan Athabascans | 0.0 /100 | #290 | Tragic 53.4% |
| Cubans | 0.0 /100 | #291 | Tragic 53.4% |
| Chickasaw | 0.0 /100 | #292 | Tragic 53.3% |
| Blacks/African Americans | 0.0 /100 | #293 | Tragic 53.3% |
| Cherokee | 0.0 /100 | #294 | Tragic 53.2% |
| Yaqui | 0.0 /100 | #295 | Tragic 53.2% |
| Sioux | 0.0 /100 | #296 | Tragic 53.0% |
| Paiute | 0.0 /100 | #297 | Tragic 52.9% |
| Immigrants | Dominica | 0.0 /100 | #298 | Tragic 52.5% |