Immigrants from Sri Lanka vs Immigrants from St. Vincent and the Grenadines GED/Equivalency
COMPARE
Immigrants from Sri Lanka
Immigrants from St. Vincent and the Grenadines
GED/Equivalency
GED/Equivalency Comparison
Immigrants from Sri Lanka
Immigrants from St. Vincent and the Grenadines
87.5%
GED/EQUIVALENCY
98.3/ 100
METRIC RATING
81st/ 347
METRIC RANK
82.0%
GED/EQUIVALENCY
0.0/ 100
METRIC RATING
294th/ 347
METRIC RANK
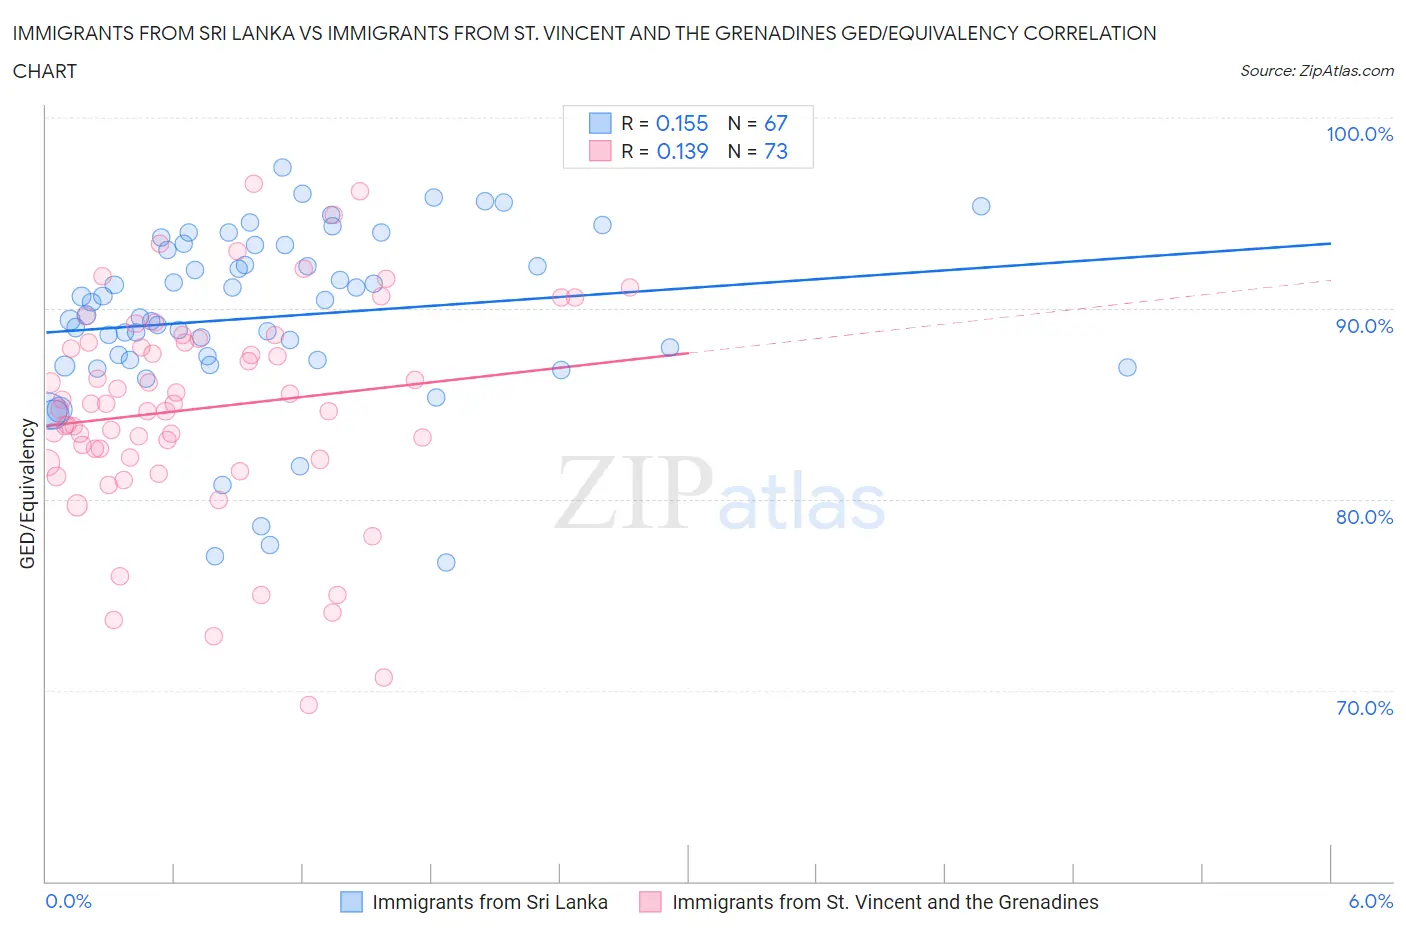
Immigrants from Sri Lanka vs Immigrants from St. Vincent and the Grenadines GED/Equivalency Correlation Chart
The statistical analysis conducted on geographies consisting of 149,671,972 people shows a poor positive correlation between the proportion of Immigrants from Sri Lanka and percentage of population with at least ged/equivalency education in the United States with a correlation coefficient (R) of 0.155 and weighted average of 87.5%. Similarly, the statistical analysis conducted on geographies consisting of 56,191,418 people shows a poor positive correlation between the proportion of Immigrants from St. Vincent and the Grenadines and percentage of population with at least ged/equivalency education in the United States with a correlation coefficient (R) of 0.139 and weighted average of 82.0%, a difference of 6.8%.
GED/Equivalency Correlation Summary
| Measurement | Immigrants from Sri Lanka | Immigrants from St. Vincent and the Grenadines |
| Minimum | 76.7% | 69.2% |
| Maximum | 97.4% | 96.6% |
| Range | 20.7% | 27.3% |
| Mean | 89.5% | 84.8% |
| Median | 89.6% | 85.0% |
| Interquartile 25% (IQ1) | 87.3% | 82.1% |
| Interquartile 75% (IQ3) | 93.3% | 88.3% |
| Interquartile Range (IQR) | 6.0% | 6.2% |
| Standard Deviation (Sample) | 4.6% | 5.6% |
| Standard Deviation (Population) | 4.6% | 5.6% |
Similar Demographics by GED/Equivalency
Demographics Similar to Immigrants from Sri Lanka by GED/Equivalency
In terms of ged/equivalency, the demographic groups most similar to Immigrants from Sri Lanka are Romanian (87.5%, a difference of 0.010%), South African (87.5%, a difference of 0.010%), Immigrants from England (87.6%, a difference of 0.040%), Immigrants from Romania (87.5%, a difference of 0.050%), and Dutch (87.5%, a difference of 0.050%).
| Demographics | Rating | Rank | GED/Equivalency |
| Immigrants | Kuwait | 98.8 /100 | #74 | Exceptional 87.7% |
| Scottish | 98.7 /100 | #75 | Exceptional 87.7% |
| Immigrants | Serbia | 98.7 /100 | #76 | Exceptional 87.7% |
| Slavs | 98.7 /100 | #77 | Exceptional 87.7% |
| Irish | 98.6 /100 | #78 | Exceptional 87.6% |
| English | 98.6 /100 | #79 | Exceptional 87.6% |
| Immigrants | England | 98.5 /100 | #80 | Exceptional 87.6% |
| Immigrants | Sri Lanka | 98.3 /100 | #81 | Exceptional 87.5% |
| Romanians | 98.3 /100 | #82 | Exceptional 87.5% |
| South Africans | 98.3 /100 | #83 | Exceptional 87.5% |
| Immigrants | Romania | 98.1 /100 | #84 | Exceptional 87.5% |
| Dutch | 98.1 /100 | #85 | Exceptional 87.5% |
| Immigrants | Europe | 98.1 /100 | #86 | Exceptional 87.5% |
| Native Hawaiians | 98.1 /100 | #87 | Exceptional 87.5% |
| Immigrants | Norway | 98.1 /100 | #88 | Exceptional 87.5% |
Demographics Similar to Immigrants from St. Vincent and the Grenadines by GED/Equivalency
In terms of ged/equivalency, the demographic groups most similar to Immigrants from St. Vincent and the Grenadines are Paiute (82.0%, a difference of 0.030%), British West Indian (82.0%, a difference of 0.030%), Nepalese (81.9%, a difference of 0.060%), Cuban (82.0%, a difference of 0.070%), and Haitian (82.1%, a difference of 0.090%).
| Demographics | Rating | Rank | GED/Equivalency |
| Japanese | 0.0 /100 | #287 | Tragic 82.4% |
| Pueblo | 0.0 /100 | #288 | Tragic 82.3% |
| Immigrants | Cambodia | 0.0 /100 | #289 | Tragic 82.2% |
| Haitians | 0.0 /100 | #290 | Tragic 82.1% |
| Cubans | 0.0 /100 | #291 | Tragic 82.0% |
| Paiute | 0.0 /100 | #292 | Tragic 82.0% |
| British West Indians | 0.0 /100 | #293 | Tragic 82.0% |
| Immigrants | St. Vincent and the Grenadines | 0.0 /100 | #294 | Tragic 82.0% |
| Nepalese | 0.0 /100 | #295 | Tragic 81.9% |
| Vietnamese | 0.0 /100 | #296 | Tragic 81.9% |
| Immigrants | Bangladesh | 0.0 /100 | #297 | Tragic 81.9% |
| Ute | 0.0 /100 | #298 | Tragic 81.8% |
| Ecuadorians | 0.0 /100 | #299 | Tragic 81.7% |
| Fijians | 0.0 /100 | #300 | Tragic 81.6% |
| Dutch West Indians | 0.0 /100 | #301 | Tragic 81.6% |