U.S. Virgin Islander vs Immigrants from St. Vincent and the Grenadines College, Under 1 year
COMPARE
U.S. Virgin Islander
Immigrants from St. Vincent and the Grenadines
College, Under 1 year
College, Under 1 year Comparison
U.S. Virgin Islanders
Immigrants from St. Vincent and the Grenadines
60.6%
COLLEGE, UNDER 1 YEAR
0.1/ 100
METRIC RATING
271st/ 347
METRIC RANK
59.6%
COLLEGE, UNDER 1 YEAR
0.0/ 100
METRIC RATING
284th/ 347
METRIC RANK
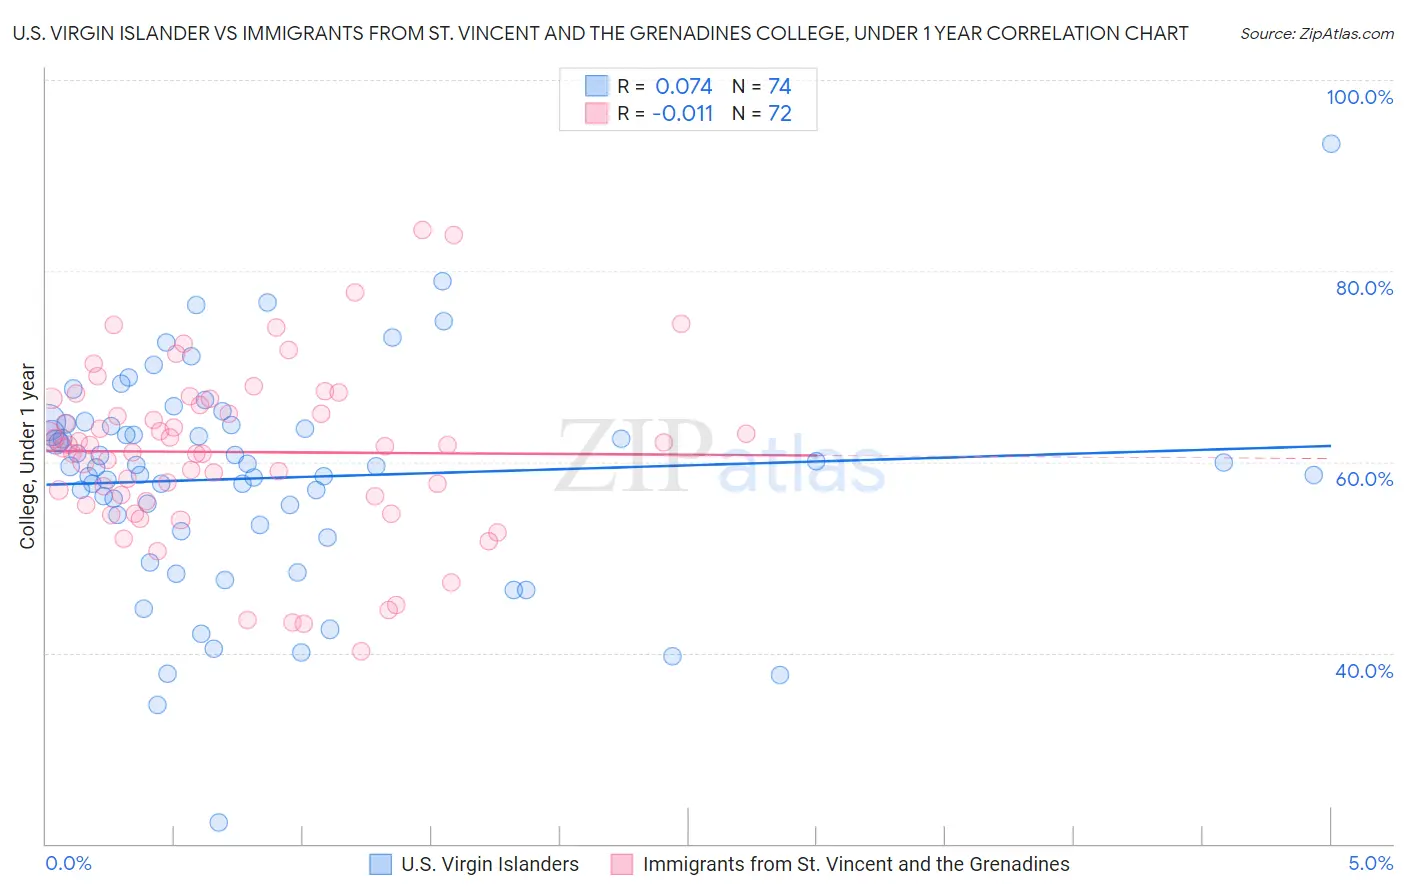
U.S. Virgin Islander vs Immigrants from St. Vincent and the Grenadines College, Under 1 year Correlation Chart
The statistical analysis conducted on geographies consisting of 87,526,675 people shows a slight positive correlation between the proportion of U.S. Virgin Islanders and percentage of population with at least college, under 1 year education in the United States with a correlation coefficient (R) of 0.074 and weighted average of 60.6%. Similarly, the statistical analysis conducted on geographies consisting of 56,185,220 people shows no correlation between the proportion of Immigrants from St. Vincent and the Grenadines and percentage of population with at least college, under 1 year education in the United States with a correlation coefficient (R) of -0.011 and weighted average of 59.6%, a difference of 1.5%.
College, Under 1 year Correlation Summary
| Measurement | U.S. Virgin Islander | Immigrants from St. Vincent and the Grenadines |
| Minimum | 22.2% | 40.2% |
| Maximum | 93.4% | 84.3% |
| Range | 71.2% | 44.1% |
| Mean | 58.3% | 61.0% |
| Median | 59.5% | 61.7% |
| Interquartile 25% (IQ1) | 53.4% | 56.1% |
| Interquartile 75% (IQ3) | 63.8% | 66.3% |
| Interquartile Range (IQR) | 10.4% | 10.1% |
| Standard Deviation (Sample) | 11.3% | 8.9% |
| Standard Deviation (Population) | 11.3% | 8.8% |
Demographics Similar to U.S. Virgin Islanders and Immigrants from St. Vincent and the Grenadines by College, Under 1 year
In terms of college, under 1 year, the demographic groups most similar to U.S. Virgin Islanders are Cheyenne (60.6%, a difference of 0.020%), Immigrants from West Indies (60.6%, a difference of 0.13%), Jamaican (60.5%, a difference of 0.16%), Chickasaw (60.4%, a difference of 0.20%), and Alaska Native (60.4%, a difference of 0.20%). Similarly, the demographic groups most similar to Immigrants from St. Vincent and the Grenadines are Paiute (59.6%, a difference of 0.010%), Immigrants from Jamaica (59.7%, a difference of 0.11%), British West Indian (59.5%, a difference of 0.15%), Sioux (59.4%, a difference of 0.32%), and Belizean (60.1%, a difference of 0.75%).
| Demographics | Rating | Rank | College, Under 1 year |
| Americans | 0.2 /100 | #267 | Tragic 61.0% |
| Immigrants | Trinidad and Tobago | 0.1 /100 | #268 | Tragic 60.7% |
| Immigrants | West Indies | 0.1 /100 | #269 | Tragic 60.6% |
| Cheyenne | 0.1 /100 | #270 | Tragic 60.6% |
| U.S. Virgin Islanders | 0.1 /100 | #271 | Tragic 60.6% |
| Jamaicans | 0.1 /100 | #272 | Tragic 60.5% |
| Chickasaw | 0.1 /100 | #273 | Tragic 60.4% |
| Alaska Natives | 0.1 /100 | #274 | Tragic 60.4% |
| Immigrants | Barbados | 0.1 /100 | #275 | Tragic 60.4% |
| Arapaho | 0.1 /100 | #276 | Tragic 60.3% |
| Bahamians | 0.1 /100 | #277 | Tragic 60.3% |
| Yaqui | 0.1 /100 | #278 | Tragic 60.2% |
| Ute | 0.1 /100 | #279 | Tragic 60.2% |
| Crow | 0.1 /100 | #280 | Tragic 60.2% |
| Cherokee | 0.1 /100 | #281 | Tragic 60.1% |
| Belizeans | 0.1 /100 | #282 | Tragic 60.1% |
| Immigrants | Jamaica | 0.0 /100 | #283 | Tragic 59.7% |
| Immigrants | St. Vincent and the Grenadines | 0.0 /100 | #284 | Tragic 59.6% |
| Paiute | 0.0 /100 | #285 | Tragic 59.6% |
| British West Indians | 0.0 /100 | #286 | Tragic 59.5% |
| Sioux | 0.0 /100 | #287 | Tragic 59.4% |