Immigrants from Spain vs Jamaican Doctorate Degree
COMPARE
Immigrants from Spain
Jamaican
Doctorate Degree
Doctorate Degree Comparison
Immigrants from Spain
Jamaicans
2.6%
DOCTORATE DEGREE
100.0/ 100
METRIC RATING
36th/ 347
METRIC RANK
1.5%
DOCTORATE DEGREE
0.3/ 100
METRIC RATING
284th/ 347
METRIC RANK
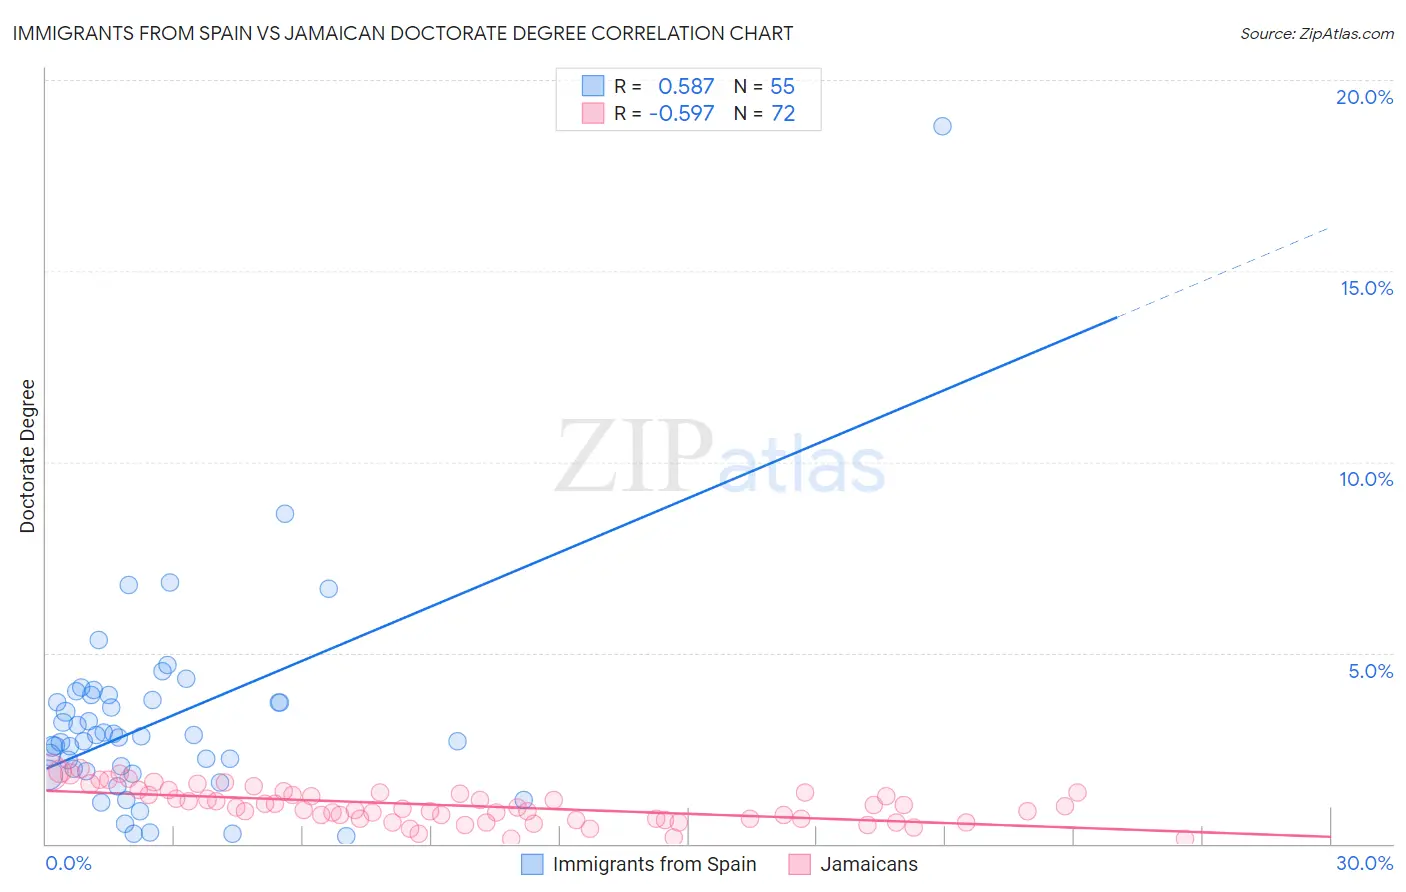
Immigrants from Spain vs Jamaican Doctorate Degree Correlation Chart
The statistical analysis conducted on geographies consisting of 238,840,570 people shows a substantial positive correlation between the proportion of Immigrants from Spain and percentage of population with at least doctorate degree education in the United States with a correlation coefficient (R) of 0.587 and weighted average of 2.6%. Similarly, the statistical analysis conducted on geographies consisting of 364,326,977 people shows a substantial negative correlation between the proportion of Jamaicans and percentage of population with at least doctorate degree education in the United States with a correlation coefficient (R) of -0.597 and weighted average of 1.5%, a difference of 76.0%.
Doctorate Degree Correlation Summary
| Measurement | Immigrants from Spain | Jamaican |
| Minimum | 0.19% | 0.12% |
| Maximum | 18.8% | 2.0% |
| Range | 18.6% | 1.8% |
| Mean | 3.2% | 1.0% |
| Median | 2.8% | 0.96% |
| Interquartile 25% (IQ1) | 1.9% | 0.64% |
| Interquartile 75% (IQ3) | 3.9% | 1.3% |
| Interquartile Range (IQR) | 2.0% | 0.69% |
| Standard Deviation (Sample) | 2.7% | 0.46% |
| Standard Deviation (Population) | 2.7% | 0.46% |
Similar Demographics by Doctorate Degree
Demographics Similar to Immigrants from Spain by Doctorate Degree
In terms of doctorate degree, the demographic groups most similar to Immigrants from Spain are Immigrants from Malaysia (2.6%, a difference of 0.060%), Cypriot (2.6%, a difference of 0.12%), Cambodian (2.6%, a difference of 0.23%), Immigrants from Kuwait (2.6%, a difference of 0.26%), and Immigrants from Northern Europe (2.6%, a difference of 0.41%).
| Demographics | Rating | Rank | Doctorate Degree |
| Immigrants | South Central Asia | 100.0 /100 | #29 | Exceptional 2.6% |
| Immigrants | Korea | 100.0 /100 | #30 | Exceptional 2.6% |
| Latvians | 100.0 /100 | #31 | Exceptional 2.6% |
| Immigrants | Northern Europe | 100.0 /100 | #32 | Exceptional 2.6% |
| Cambodians | 100.0 /100 | #33 | Exceptional 2.6% |
| Cypriots | 100.0 /100 | #34 | Exceptional 2.6% |
| Immigrants | Malaysia | 100.0 /100 | #35 | Exceptional 2.6% |
| Immigrants | Spain | 100.0 /100 | #36 | Exceptional 2.6% |
| Immigrants | Kuwait | 100.0 /100 | #37 | Exceptional 2.6% |
| Russians | 100.0 /100 | #38 | Exceptional 2.6% |
| Immigrants | Ireland | 100.0 /100 | #39 | Exceptional 2.5% |
| Estonians | 100.0 /100 | #40 | Exceptional 2.5% |
| Immigrants | Russia | 100.0 /100 | #41 | Exceptional 2.5% |
| New Zealanders | 100.0 /100 | #42 | Exceptional 2.5% |
| Soviet Union | 100.0 /100 | #43 | Exceptional 2.5% |
Demographics Similar to Jamaicans by Doctorate Degree
In terms of doctorate degree, the demographic groups most similar to Jamaicans are Malaysian (1.5%, a difference of 0.030%), Central American (1.5%, a difference of 0.040%), British West Indian (1.5%, a difference of 0.090%), Tohono O'odham (1.5%, a difference of 0.14%), and Ecuadorian (1.5%, a difference of 0.20%).
| Demographics | Rating | Rank | Doctorate Degree |
| Bahamians | 0.4 /100 | #277 | Tragic 1.5% |
| Hawaiians | 0.4 /100 | #278 | Tragic 1.5% |
| Marshallese | 0.4 /100 | #279 | Tragic 1.5% |
| Ecuadorians | 0.4 /100 | #280 | Tragic 1.5% |
| Tohono O'odham | 0.4 /100 | #281 | Tragic 1.5% |
| British West Indians | 0.3 /100 | #282 | Tragic 1.5% |
| Central Americans | 0.3 /100 | #283 | Tragic 1.5% |
| Jamaicans | 0.3 /100 | #284 | Tragic 1.5% |
| Malaysians | 0.3 /100 | #285 | Tragic 1.5% |
| Cherokee | 0.3 /100 | #286 | Tragic 1.5% |
| Cajuns | 0.3 /100 | #287 | Tragic 1.5% |
| Immigrants | El Salvador | 0.3 /100 | #288 | Tragic 1.4% |
| Cape Verdeans | 0.3 /100 | #289 | Tragic 1.4% |
| Choctaw | 0.3 /100 | #290 | Tragic 1.4% |
| Blacks/African Americans | 0.3 /100 | #291 | Tragic 1.4% |