Immigrants from Spain vs Palestinian Disability Age 18 to 34
COMPARE
Immigrants from Spain
Palestinian
Disability Age 18 to 34
Disability Age 18 to 34 Comparison
Immigrants from Spain
Palestinians
5.9%
DISABILITY AGE 18 TO 34
99.7/ 100
METRIC RATING
55th/ 347
METRIC RANK
6.4%
DISABILITY AGE 18 TO 34
88.5/ 100
METRIC RATING
135th/ 347
METRIC RANK
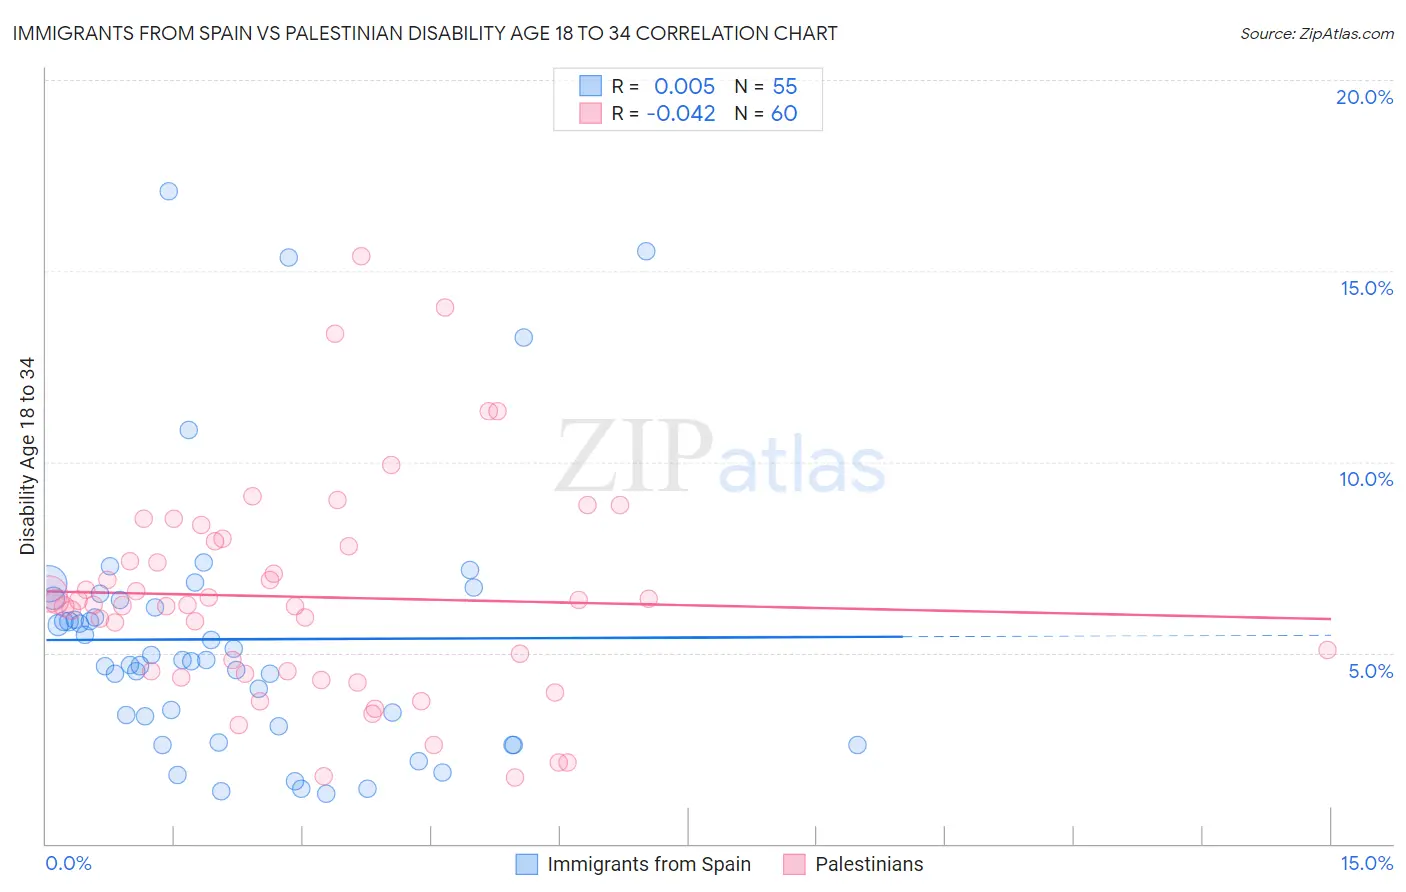
Immigrants from Spain vs Palestinian Disability Age 18 to 34 Correlation Chart
The statistical analysis conducted on geographies consisting of 239,463,764 people shows no correlation between the proportion of Immigrants from Spain and percentage of population with a disability between the ages 18 and 35 in the United States with a correlation coefficient (R) of 0.005 and weighted average of 5.9%. Similarly, the statistical analysis conducted on geographies consisting of 216,373,033 people shows no correlation between the proportion of Palestinians and percentage of population with a disability between the ages 18 and 35 in the United States with a correlation coefficient (R) of -0.042 and weighted average of 6.4%, a difference of 7.3%.
Disability Age 18 to 34 Correlation Summary
| Measurement | Immigrants from Spain | Palestinian |
| Minimum | 1.3% | 1.7% |
| Maximum | 17.1% | 15.4% |
| Range | 15.8% | 13.7% |
| Mean | 5.4% | 6.5% |
| Median | 4.8% | 6.3% |
| Interquartile 25% (IQ1) | 3.1% | 4.5% |
| Interquartile 75% (IQ3) | 6.4% | 7.9% |
| Interquartile Range (IQR) | 3.3% | 3.4% |
| Standard Deviation (Sample) | 3.4% | 2.8% |
| Standard Deviation (Population) | 3.4% | 2.8% |
Similar Demographics by Disability Age 18 to 34
Demographics Similar to Immigrants from Spain by Disability Age 18 to 34
In terms of disability age 18 to 34, the demographic groups most similar to Immigrants from Spain are Immigrants from Malaysia (5.9%, a difference of 0.010%), Immigrants from Indonesia (5.9%, a difference of 0.060%), Paraguayan (5.9%, a difference of 0.16%), Okinawan (5.9%, a difference of 0.21%), and Immigrants from Haiti (5.9%, a difference of 0.27%).
| Demographics | Rating | Rank | Disability Age 18 to 34 |
| Immigrants | Trinidad and Tobago | 99.8 /100 | #48 | Exceptional 5.9% |
| Immigrants | Belarus | 99.8 /100 | #49 | Exceptional 5.9% |
| Immigrants | El Salvador | 99.8 /100 | #50 | Exceptional 5.9% |
| Egyptians | 99.8 /100 | #51 | Exceptional 5.9% |
| Okinawans | 99.7 /100 | #52 | Exceptional 5.9% |
| Immigrants | Indonesia | 99.7 /100 | #53 | Exceptional 5.9% |
| Immigrants | Malaysia | 99.7 /100 | #54 | Exceptional 5.9% |
| Immigrants | Spain | 99.7 /100 | #55 | Exceptional 5.9% |
| Paraguayans | 99.7 /100 | #56 | Exceptional 5.9% |
| Immigrants | Haiti | 99.7 /100 | #57 | Exceptional 5.9% |
| Immigrants | Serbia | 99.7 /100 | #58 | Exceptional 5.9% |
| Immigrants | Caribbean | 99.6 /100 | #59 | Exceptional 6.0% |
| Immigrants | Sri Lanka | 99.6 /100 | #60 | Exceptional 6.0% |
| British West Indians | 99.6 /100 | #61 | Exceptional 6.0% |
| Peruvians | 99.6 /100 | #62 | Exceptional 6.0% |
Demographics Similar to Palestinians by Disability Age 18 to 34
In terms of disability age 18 to 34, the demographic groups most similar to Palestinians are Immigrants from Sweden (6.4%, a difference of 0.010%), Immigrants from Europe (6.4%, a difference of 0.040%), Brazilian (6.4%, a difference of 0.080%), Immigrants from Honduras (6.4%, a difference of 0.14%), and Spanish American Indian (6.4%, a difference of 0.14%).
| Demographics | Rating | Rank | Disability Age 18 to 34 |
| Chinese | 91.9 /100 | #128 | Exceptional 6.3% |
| Immigrants | Italy | 90.5 /100 | #129 | Exceptional 6.3% |
| Immigrants | Dominica | 90.5 /100 | #130 | Exceptional 6.3% |
| Immigrants | Saudi Arabia | 90.4 /100 | #131 | Exceptional 6.3% |
| Guatemalans | 89.6 /100 | #132 | Excellent 6.4% |
| Brazilians | 89.0 /100 | #133 | Excellent 6.4% |
| Immigrants | Europe | 88.8 /100 | #134 | Excellent 6.4% |
| Palestinians | 88.5 /100 | #135 | Excellent 6.4% |
| Immigrants | Sweden | 88.5 /100 | #136 | Excellent 6.4% |
| Immigrants | Honduras | 87.7 /100 | #137 | Excellent 6.4% |
| Spanish American Indians | 87.7 /100 | #138 | Excellent 6.4% |
| Immigrants | Belize | 87.4 /100 | #139 | Excellent 6.4% |
| Immigrants | Fiji | 87.3 /100 | #140 | Excellent 6.4% |
| Jamaicans | 86.8 /100 | #141 | Excellent 6.4% |
| South American Indians | 86.5 /100 | #142 | Excellent 6.4% |