Immigrants from Bulgaria vs Immigrants from Ireland College, Under 1 year
COMPARE
Immigrants from Bulgaria
Immigrants from Ireland
College, Under 1 year
College, Under 1 year Comparison
Immigrants from Bulgaria
Immigrants from Ireland
70.0%
COLLEGE, UNDER 1 YEAR
99.8/ 100
METRIC RATING
47th/ 347
METRIC RANK
71.0%
COLLEGE, UNDER 1 YEAR
100.0/ 100
METRIC RATING
27th/ 347
METRIC RANK
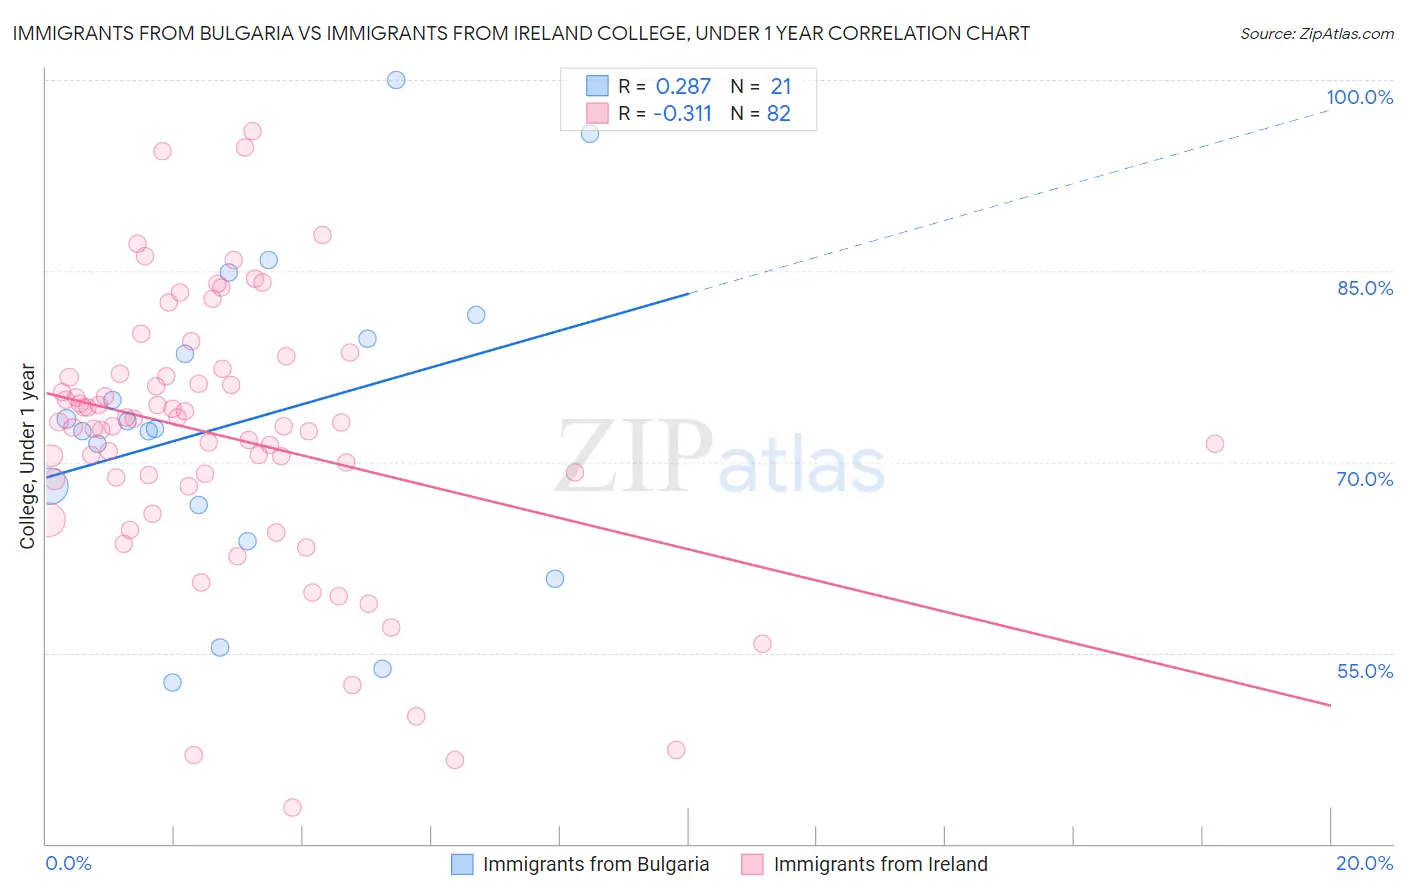
Immigrants from Bulgaria vs Immigrants from Ireland College, Under 1 year Correlation Chart
The statistical analysis conducted on geographies consisting of 172,550,092 people shows a weak positive correlation between the proportion of Immigrants from Bulgaria and percentage of population with at least college, under 1 year education in the United States with a correlation coefficient (R) of 0.287 and weighted average of 70.0%. Similarly, the statistical analysis conducted on geographies consisting of 240,784,591 people shows a mild negative correlation between the proportion of Immigrants from Ireland and percentage of population with at least college, under 1 year education in the United States with a correlation coefficient (R) of -0.311 and weighted average of 71.0%, a difference of 1.4%.
College, Under 1 year Correlation Summary
| Measurement | Immigrants from Bulgaria | Immigrants from Ireland |
| Minimum | 52.7% | 42.8% |
| Maximum | 100.0% | 96.0% |
| Range | 47.3% | 53.2% |
| Mean | 73.2% | 72.0% |
| Median | 72.6% | 73.0% |
| Interquartile 25% (IQ1) | 65.2% | 68.7% |
| Interquartile 75% (IQ3) | 80.6% | 76.8% |
| Interquartile Range (IQR) | 15.4% | 8.1% |
| Standard Deviation (Sample) | 12.4% | 10.6% |
| Standard Deviation (Population) | 12.1% | 10.5% |
Demographics Similar to Immigrants from Bulgaria and Immigrants from Ireland by College, Under 1 year
In terms of college, under 1 year, the demographic groups most similar to Immigrants from Bulgaria are Immigrants from Latvia (70.1%, a difference of 0.11%), Immigrants from Norway (70.2%, a difference of 0.23%), New Zealander (70.2%, a difference of 0.25%), Israeli (70.2%, a difference of 0.26%), and Immigrants from Lithuania (70.3%, a difference of 0.32%). Similarly, the demographic groups most similar to Immigrants from Ireland are Immigrants from Hong Kong (71.0%, a difference of 0.030%), Immigrants from France (71.0%, a difference of 0.030%), Immigrants from China (70.9%, a difference of 0.21%), Indian (Asian) (70.8%, a difference of 0.32%), and Turkish (70.7%, a difference of 0.40%).
| Demographics | Rating | Rank | College, Under 1 year |
| Immigrants | Ireland | 100.0 /100 | #27 | Exceptional 71.0% |
| Immigrants | Hong Kong | 100.0 /100 | #28 | Exceptional 71.0% |
| Immigrants | France | 100.0 /100 | #29 | Exceptional 71.0% |
| Immigrants | China | 99.9 /100 | #30 | Exceptional 70.9% |
| Indians (Asian) | 99.9 /100 | #31 | Exceptional 70.8% |
| Turks | 99.9 /100 | #32 | Exceptional 70.7% |
| Immigrants | South Africa | 99.9 /100 | #33 | Exceptional 70.6% |
| Estonians | 99.9 /100 | #34 | Exceptional 70.6% |
| Russians | 99.9 /100 | #35 | Exceptional 70.5% |
| Immigrants | Sri Lanka | 99.9 /100 | #36 | Exceptional 70.5% |
| Immigrants | Saudi Arabia | 99.9 /100 | #37 | Exceptional 70.4% |
| Australians | 99.9 /100 | #38 | Exceptional 70.4% |
| Bhutanese | 99.9 /100 | #39 | Exceptional 70.3% |
| Immigrants | Turkey | 99.9 /100 | #40 | Exceptional 70.3% |
| Immigrants | Kuwait | 99.9 /100 | #41 | Exceptional 70.3% |
| Immigrants | Lithuania | 99.9 /100 | #42 | Exceptional 70.3% |
| Israelis | 99.9 /100 | #43 | Exceptional 70.2% |
| New Zealanders | 99.9 /100 | #44 | Exceptional 70.2% |
| Immigrants | Norway | 99.9 /100 | #45 | Exceptional 70.2% |
| Immigrants | Latvia | 99.9 /100 | #46 | Exceptional 70.1% |
| Immigrants | Bulgaria | 99.8 /100 | #47 | Exceptional 70.0% |