British West Indian vs Immigrants from Ireland College, Under 1 year
COMPARE
British West Indian
Immigrants from Ireland
College, Under 1 year
College, Under 1 year Comparison
British West Indians
Immigrants from Ireland
59.5%
COLLEGE, UNDER 1 YEAR
0.0/ 100
METRIC RATING
286th/ 347
METRIC RANK
71.0%
COLLEGE, UNDER 1 YEAR
100.0/ 100
METRIC RATING
27th/ 347
METRIC RANK
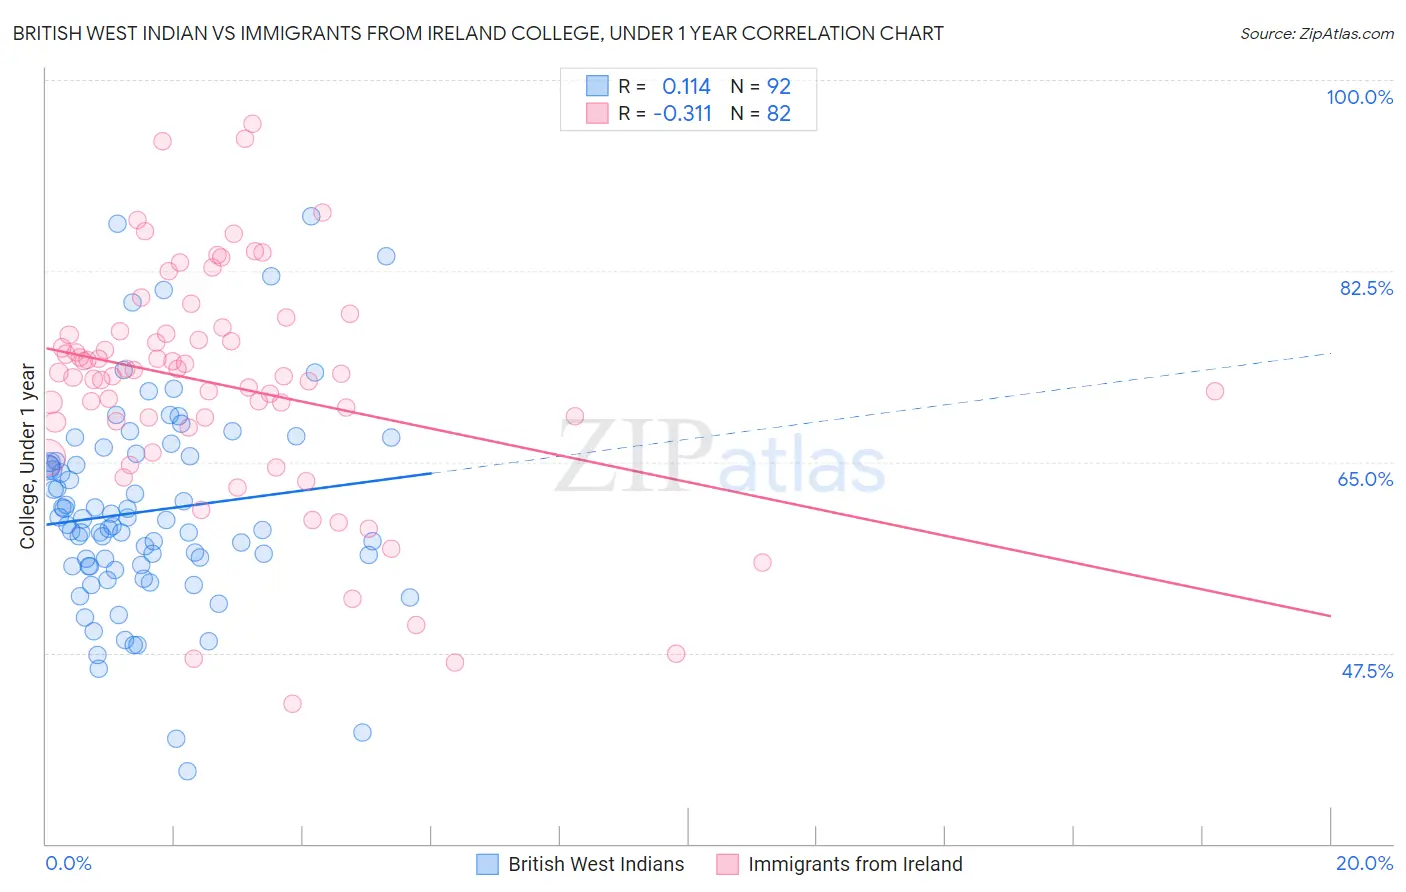
British West Indian vs Immigrants from Ireland College, Under 1 year Correlation Chart
The statistical analysis conducted on geographies consisting of 152,695,779 people shows a poor positive correlation between the proportion of British West Indians and percentage of population with at least college, under 1 year education in the United States with a correlation coefficient (R) of 0.114 and weighted average of 59.5%. Similarly, the statistical analysis conducted on geographies consisting of 240,784,591 people shows a mild negative correlation between the proportion of Immigrants from Ireland and percentage of population with at least college, under 1 year education in the United States with a correlation coefficient (R) of -0.311 and weighted average of 71.0%, a difference of 19.2%.
College, Under 1 year Correlation Summary
| Measurement | British West Indian | Immigrants from Ireland |
| Minimum | 36.6% | 42.8% |
| Maximum | 87.5% | 96.0% |
| Range | 50.8% | 53.2% |
| Mean | 60.5% | 72.0% |
| Median | 59.2% | 73.0% |
| Interquartile 25% (IQ1) | 55.5% | 68.7% |
| Interquartile 75% (IQ3) | 65.3% | 76.8% |
| Interquartile Range (IQR) | 9.8% | 8.1% |
| Standard Deviation (Sample) | 9.4% | 10.6% |
| Standard Deviation (Population) | 9.3% | 10.5% |
Similar Demographics by College, Under 1 year
Demographics Similar to British West Indians by College, Under 1 year
In terms of college, under 1 year, the demographic groups most similar to British West Indians are Paiute (59.6%, a difference of 0.14%), Immigrants from St. Vincent and the Grenadines (59.6%, a difference of 0.15%), Sioux (59.4%, a difference of 0.17%), Immigrants from Jamaica (59.7%, a difference of 0.27%), and Black/African American (59.4%, a difference of 0.27%).
| Demographics | Rating | Rank | College, Under 1 year |
| Ute | 0.1 /100 | #279 | Tragic 60.2% |
| Crow | 0.1 /100 | #280 | Tragic 60.2% |
| Cherokee | 0.1 /100 | #281 | Tragic 60.1% |
| Belizeans | 0.1 /100 | #282 | Tragic 60.1% |
| Immigrants | Jamaica | 0.0 /100 | #283 | Tragic 59.7% |
| Immigrants | St. Vincent and the Grenadines | 0.0 /100 | #284 | Tragic 59.6% |
| Paiute | 0.0 /100 | #285 | Tragic 59.6% |
| British West Indians | 0.0 /100 | #286 | Tragic 59.5% |
| Sioux | 0.0 /100 | #287 | Tragic 59.4% |
| Blacks/African Americans | 0.0 /100 | #288 | Tragic 59.4% |
| Choctaw | 0.0 /100 | #289 | Tragic 59.3% |
| Ecuadorians | 0.0 /100 | #290 | Tragic 59.3% |
| Creek | 0.0 /100 | #291 | Tragic 59.3% |
| Nicaraguans | 0.0 /100 | #292 | Tragic 59.2% |
| Seminole | 0.0 /100 | #293 | Tragic 59.1% |
Demographics Similar to Immigrants from Ireland by College, Under 1 year
In terms of college, under 1 year, the demographic groups most similar to Immigrants from Ireland are Immigrants from Denmark (71.0%, a difference of 0.010%), Immigrants from Hong Kong (71.0%, a difference of 0.030%), Immigrants from France (71.0%, a difference of 0.030%), Bulgarian (71.1%, a difference of 0.13%), and Soviet Union (71.1%, a difference of 0.14%).
| Demographics | Rating | Rank | College, Under 1 year |
| Immigrants | Korea | 100.0 /100 | #20 | Exceptional 71.6% |
| Immigrants | Belgium | 100.0 /100 | #21 | Exceptional 71.5% |
| Immigrants | Eastern Asia | 100.0 /100 | #22 | Exceptional 71.3% |
| Immigrants | Northern Europe | 100.0 /100 | #23 | Exceptional 71.1% |
| Soviet Union | 100.0 /100 | #24 | Exceptional 71.1% |
| Bulgarians | 100.0 /100 | #25 | Exceptional 71.1% |
| Immigrants | Denmark | 100.0 /100 | #26 | Exceptional 71.0% |
| Immigrants | Ireland | 100.0 /100 | #27 | Exceptional 71.0% |
| Immigrants | Hong Kong | 100.0 /100 | #28 | Exceptional 71.0% |
| Immigrants | France | 100.0 /100 | #29 | Exceptional 71.0% |
| Immigrants | China | 99.9 /100 | #30 | Exceptional 70.9% |
| Indians (Asian) | 99.9 /100 | #31 | Exceptional 70.8% |
| Turks | 99.9 /100 | #32 | Exceptional 70.7% |
| Immigrants | South Africa | 99.9 /100 | #33 | Exceptional 70.6% |
| Estonians | 99.9 /100 | #34 | Exceptional 70.6% |