Moroccan vs Immigrants from Ireland College, Under 1 year
COMPARE
Moroccan
Immigrants from Ireland
College, Under 1 year
College, Under 1 year Comparison
Moroccans
Immigrants from Ireland
65.6%
COLLEGE, UNDER 1 YEAR
56.7/ 100
METRIC RATING
166th/ 347
METRIC RANK
71.0%
COLLEGE, UNDER 1 YEAR
100.0/ 100
METRIC RATING
27th/ 347
METRIC RANK
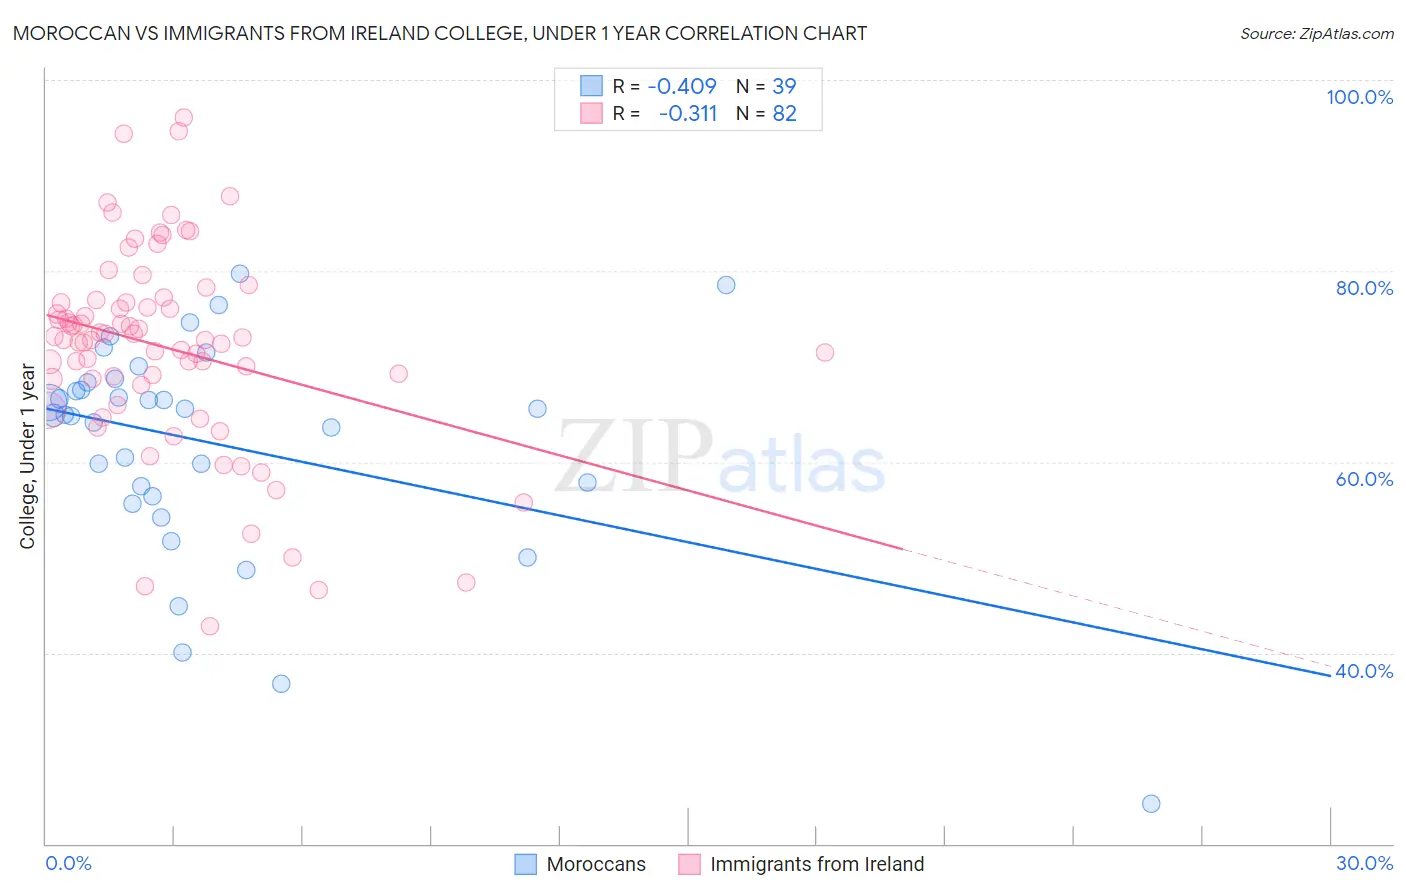
Moroccan vs Immigrants from Ireland College, Under 1 year Correlation Chart
The statistical analysis conducted on geographies consisting of 201,817,667 people shows a moderate negative correlation between the proportion of Moroccans and percentage of population with at least college, under 1 year education in the United States with a correlation coefficient (R) of -0.409 and weighted average of 65.6%. Similarly, the statistical analysis conducted on geographies consisting of 240,784,591 people shows a mild negative correlation between the proportion of Immigrants from Ireland and percentage of population with at least college, under 1 year education in the United States with a correlation coefficient (R) of -0.311 and weighted average of 71.0%, a difference of 8.2%.
College, Under 1 year Correlation Summary
| Measurement | Moroccan | Immigrants from Ireland |
| Minimum | 24.2% | 42.8% |
| Maximum | 79.7% | 96.0% |
| Range | 55.5% | 53.2% |
| Mean | 61.8% | 72.0% |
| Median | 64.9% | 73.0% |
| Interquartile 25% (IQ1) | 56.5% | 68.7% |
| Interquartile 75% (IQ3) | 68.4% | 76.8% |
| Interquartile Range (IQR) | 11.9% | 8.1% |
| Standard Deviation (Sample) | 11.6% | 10.6% |
| Standard Deviation (Population) | 11.4% | 10.5% |
Similar Demographics by College, Under 1 year
Demographics Similar to Moroccans by College, Under 1 year
In terms of college, under 1 year, the demographic groups most similar to Moroccans are Immigrants from Somalia (65.6%, a difference of 0.010%), Hungarian (65.6%, a difference of 0.030%), Yugoslavian (65.6%, a difference of 0.040%), German (65.6%, a difference of 0.040%), and Immigrants from Oceania (65.6%, a difference of 0.080%).
| Demographics | Rating | Rank | College, Under 1 year |
| Tlingit-Haida | 66.4 /100 | #159 | Good 65.9% |
| Albanians | 66.1 /100 | #160 | Good 65.9% |
| Brazilians | 66.0 /100 | #161 | Good 65.9% |
| Koreans | 65.3 /100 | #162 | Good 65.9% |
| Somalis | 62.7 /100 | #163 | Good 65.8% |
| Czechoslovakians | 62.6 /100 | #164 | Good 65.8% |
| Immigrants | Uzbekistan | 61.6 /100 | #165 | Good 65.8% |
| Moroccans | 56.7 /100 | #166 | Average 65.6% |
| Immigrants | Somalia | 56.4 /100 | #167 | Average 65.6% |
| Hungarians | 55.9 /100 | #168 | Average 65.6% |
| Yugoslavians | 55.7 /100 | #169 | Average 65.6% |
| Germans | 55.7 /100 | #170 | Average 65.6% |
| Immigrants | Oceania | 55.0 /100 | #171 | Average 65.6% |
| South American Indians | 54.4 /100 | #172 | Average 65.5% |
| Swiss | 53.9 /100 | #173 | Average 65.5% |
Demographics Similar to Immigrants from Ireland by College, Under 1 year
In terms of college, under 1 year, the demographic groups most similar to Immigrants from Ireland are Immigrants from Denmark (71.0%, a difference of 0.010%), Immigrants from Hong Kong (71.0%, a difference of 0.030%), Immigrants from France (71.0%, a difference of 0.030%), Bulgarian (71.1%, a difference of 0.13%), and Soviet Union (71.1%, a difference of 0.14%).
| Demographics | Rating | Rank | College, Under 1 year |
| Immigrants | Korea | 100.0 /100 | #20 | Exceptional 71.6% |
| Immigrants | Belgium | 100.0 /100 | #21 | Exceptional 71.5% |
| Immigrants | Eastern Asia | 100.0 /100 | #22 | Exceptional 71.3% |
| Immigrants | Northern Europe | 100.0 /100 | #23 | Exceptional 71.1% |
| Soviet Union | 100.0 /100 | #24 | Exceptional 71.1% |
| Bulgarians | 100.0 /100 | #25 | Exceptional 71.1% |
| Immigrants | Denmark | 100.0 /100 | #26 | Exceptional 71.0% |
| Immigrants | Ireland | 100.0 /100 | #27 | Exceptional 71.0% |
| Immigrants | Hong Kong | 100.0 /100 | #28 | Exceptional 71.0% |
| Immigrants | France | 100.0 /100 | #29 | Exceptional 71.0% |
| Immigrants | China | 99.9 /100 | #30 | Exceptional 70.9% |
| Indians (Asian) | 99.9 /100 | #31 | Exceptional 70.8% |
| Turks | 99.9 /100 | #32 | Exceptional 70.7% |
| Immigrants | South Africa | 99.9 /100 | #33 | Exceptional 70.6% |
| Estonians | 99.9 /100 | #34 | Exceptional 70.6% |