Immigrants from Southern Europe vs Immigrants from Sudan Female Poverty Among 25-34 Year Olds
COMPARE
Immigrants from Southern Europe
Immigrants from Sudan
Female Poverty Among 25-34 Year Olds
Female Poverty Among 25-34 Year Olds Comparison
Immigrants from Southern Europe
Immigrants from Sudan
12.8%
FEMALE POVERTY AMONG 25-34 YEAR OLDS
93.6/ 100
METRIC RATING
114th/ 347
METRIC RANK
14.4%
FEMALE POVERTY AMONG 25-34 YEAR OLDS
4.0/ 100
METRIC RATING
224th/ 347
METRIC RANK
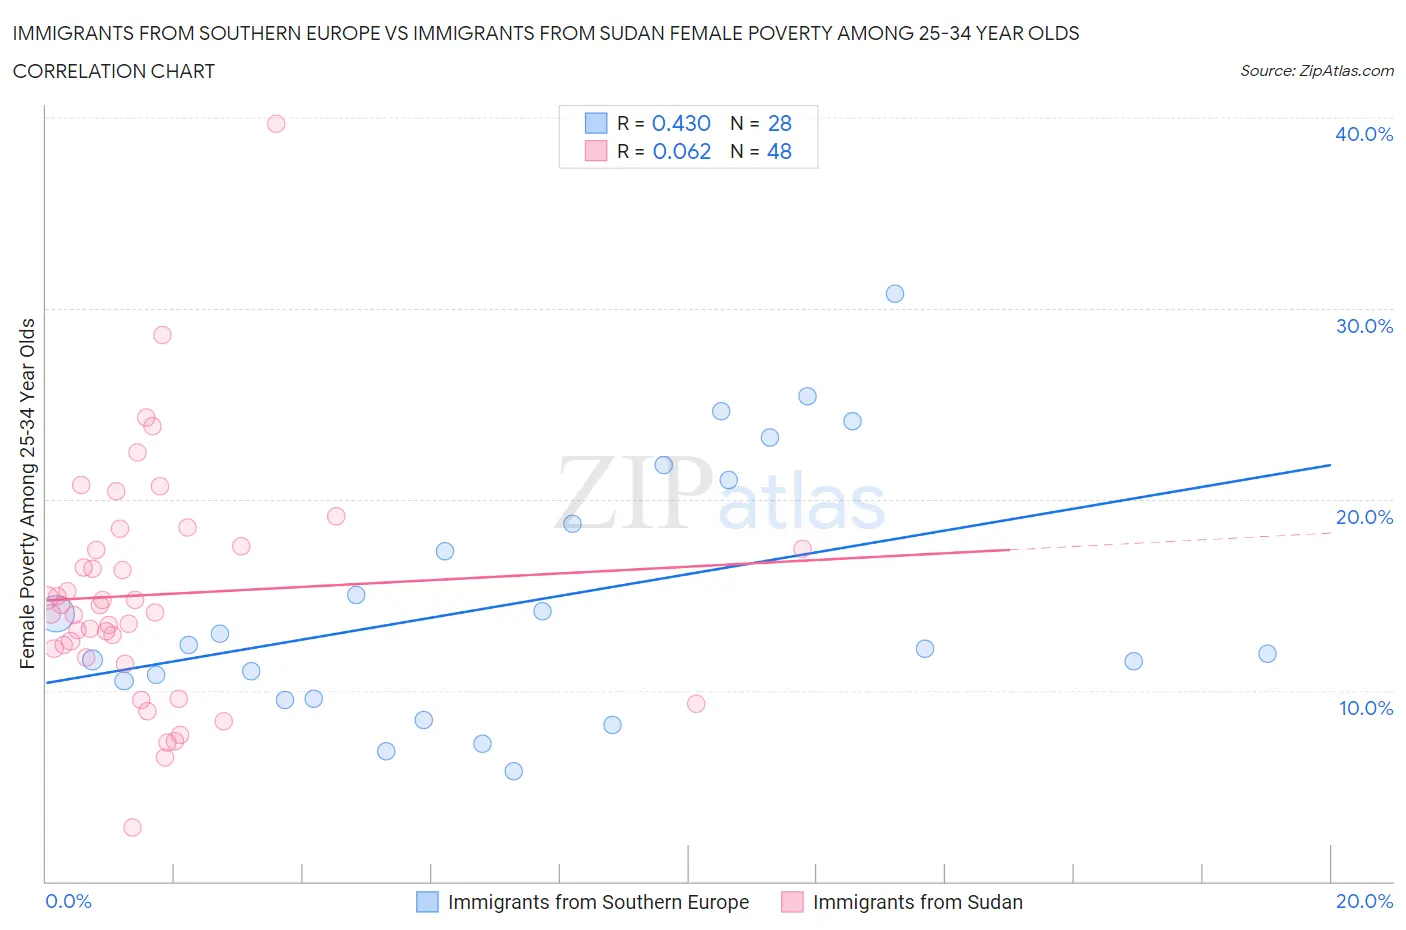
Immigrants from Southern Europe vs Immigrants from Sudan Female Poverty Among 25-34 Year Olds Correlation Chart
The statistical analysis conducted on geographies consisting of 394,458,133 people shows a moderate positive correlation between the proportion of Immigrants from Southern Europe and poverty level among females between the ages 25 and 34 in the United States with a correlation coefficient (R) of 0.430 and weighted average of 12.8%. Similarly, the statistical analysis conducted on geographies consisting of 118,579,963 people shows a slight positive correlation between the proportion of Immigrants from Sudan and poverty level among females between the ages 25 and 34 in the United States with a correlation coefficient (R) of 0.062 and weighted average of 14.4%, a difference of 12.9%.
Female Poverty Among 25-34 Year Olds Correlation Summary
| Measurement | Immigrants from Southern Europe | Immigrants from Sudan |
| Minimum | 5.8% | 2.8% |
| Maximum | 30.8% | 39.6% |
| Range | 25.0% | 36.9% |
| Mean | 14.7% | 15.0% |
| Median | 12.3% | 14.3% |
| Interquartile 25% (IQ1) | 10.0% | 12.0% |
| Interquartile 75% (IQ3) | 19.9% | 17.5% |
| Interquartile Range (IQR) | 9.9% | 5.5% |
| Standard Deviation (Sample) | 6.6% | 6.2% |
| Standard Deviation (Population) | 6.5% | 6.1% |
Similar Demographics by Female Poverty Among 25-34 Year Olds
Demographics Similar to Immigrants from Southern Europe by Female Poverty Among 25-34 Year Olds
In terms of female poverty among 25-34 year olds, the demographic groups most similar to Immigrants from Southern Europe are Immigrants from Syria (12.8%, a difference of 0.070%), Immigrants from Brazil (12.8%, a difference of 0.090%), Immigrants from Morocco (12.8%, a difference of 0.11%), Danish (12.8%, a difference of 0.13%), and Chilean (12.8%, a difference of 0.13%).
| Demographics | Rating | Rank | Female Poverty Among 25-34 Year Olds |
| Poles | 94.9 /100 | #107 | Exceptional 12.7% |
| Immigrants | Norway | 94.4 /100 | #108 | Exceptional 12.7% |
| Immigrants | Peru | 94.3 /100 | #109 | Exceptional 12.7% |
| Australians | 94.1 /100 | #110 | Exceptional 12.8% |
| Danes | 93.9 /100 | #111 | Exceptional 12.8% |
| Immigrants | Morocco | 93.9 /100 | #112 | Exceptional 12.8% |
| Immigrants | Syria | 93.8 /100 | #113 | Exceptional 12.8% |
| Immigrants | Southern Europe | 93.6 /100 | #114 | Exceptional 12.8% |
| Immigrants | Brazil | 93.3 /100 | #115 | Exceptional 12.8% |
| Chileans | 93.2 /100 | #116 | Exceptional 12.8% |
| Immigrants | Kuwait | 93.1 /100 | #117 | Exceptional 12.8% |
| Mongolians | 93.0 /100 | #118 | Exceptional 12.8% |
| Immigrants | Nepal | 93.0 /100 | #119 | Exceptional 12.8% |
| Carpatho Rusyns | 93.0 /100 | #120 | Exceptional 12.8% |
| Romanians | 92.8 /100 | #121 | Exceptional 12.8% |
Demographics Similar to Immigrants from Sudan by Female Poverty Among 25-34 Year Olds
In terms of female poverty among 25-34 year olds, the demographic groups most similar to Immigrants from Sudan are Nigerian (14.4%, a difference of 0.070%), Immigrants from Portugal (14.4%, a difference of 0.13%), Sudanese (14.4%, a difference of 0.20%), Immigrants from Barbados (14.5%, a difference of 0.32%), and Ghanaian (14.4%, a difference of 0.36%).
| Demographics | Rating | Rank | Female Poverty Among 25-34 Year Olds |
| Spanish American Indians | 5.5 /100 | #217 | Tragic 14.3% |
| Immigrants | Thailand | 5.2 /100 | #218 | Tragic 14.3% |
| Ecuadorians | 5.2 /100 | #219 | Tragic 14.3% |
| Ghanaians | 4.8 /100 | #220 | Tragic 14.4% |
| Sudanese | 4.4 /100 | #221 | Tragic 14.4% |
| Immigrants | Portugal | 4.3 /100 | #222 | Tragic 14.4% |
| Nigerians | 4.2 /100 | #223 | Tragic 14.4% |
| Immigrants | Sudan | 4.0 /100 | #224 | Tragic 14.4% |
| Immigrants | Barbados | 3.4 /100 | #225 | Tragic 14.5% |
| Nicaraguans | 3.3 /100 | #226 | Tragic 14.5% |
| Celtics | 2.8 /100 | #227 | Tragic 14.5% |
| Vietnamese | 2.6 /100 | #228 | Tragic 14.6% |
| Spanish | 2.5 /100 | #229 | Tragic 14.6% |
| Spaniards | 2.3 /100 | #230 | Tragic 14.6% |
| Delaware | 2.3 /100 | #231 | Tragic 14.6% |