Immigrants from South Africa vs Immigrants from Nicaragua Births to Unmarried Women
COMPARE
Immigrants from South Africa
Immigrants from Nicaragua
Births to Unmarried Women
Births to Unmarried Women Comparison
Immigrants from South Africa
Immigrants from Nicaragua
29.3%
BIRTHS TO UNMARRIED WOMEN
95.7/ 100
METRIC RATING
97th/ 347
METRIC RANK
38.0%
BIRTHS TO UNMARRIED WOMEN
0.0/ 100
METRIC RATING
293rd/ 347
METRIC RANK
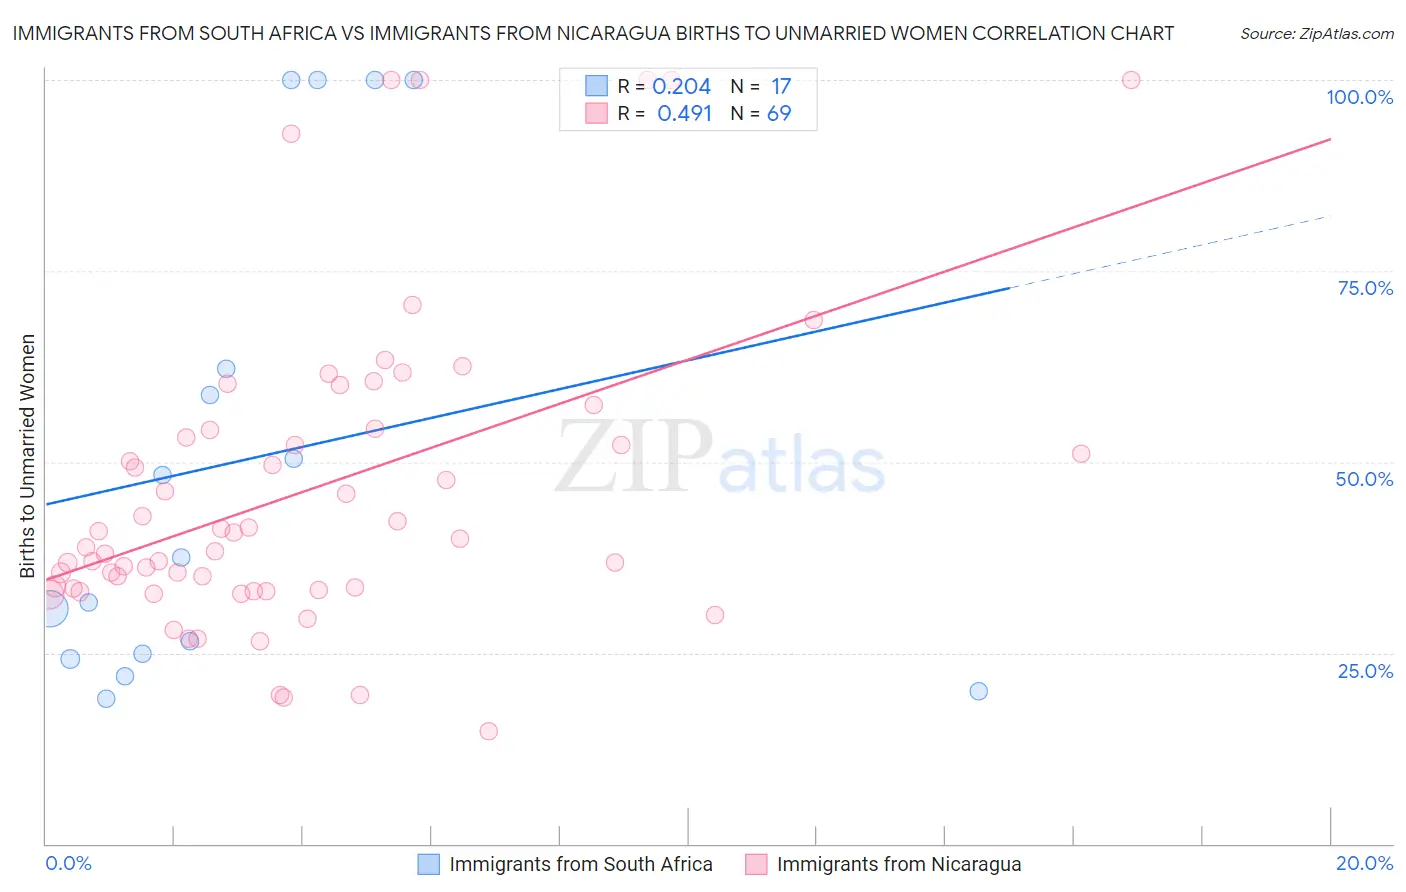
Immigrants from South Africa vs Immigrants from Nicaragua Births to Unmarried Women Correlation Chart
The statistical analysis conducted on geographies consisting of 219,322,992 people shows a weak positive correlation between the proportion of Immigrants from South Africa and percentage of births to unmarried women in the United States with a correlation coefficient (R) of 0.204 and weighted average of 29.3%. Similarly, the statistical analysis conducted on geographies consisting of 229,303,560 people shows a moderate positive correlation between the proportion of Immigrants from Nicaragua and percentage of births to unmarried women in the United States with a correlation coefficient (R) of 0.491 and weighted average of 38.0%, a difference of 29.4%.
Births to Unmarried Women Correlation Summary
| Measurement | Immigrants from South Africa | Immigrants from Nicaragua |
| Minimum | 19.0% | 14.7% |
| Maximum | 100.0% | 100.0% |
| Range | 81.0% | 85.3% |
| Mean | 50.4% | 46.4% |
| Median | 37.5% | 40.0% |
| Interquartile 25% (IQ1) | 24.5% | 33.3% |
| Interquartile 75% (IQ3) | 81.1% | 54.2% |
| Interquartile Range (IQR) | 56.6% | 21.0% |
| Standard Deviation (Sample) | 31.2% | 20.4% |
| Standard Deviation (Population) | 30.3% | 20.2% |
Similar Demographics by Births to Unmarried Women
Demographics Similar to Immigrants from South Africa by Births to Unmarried Women
In terms of births to unmarried women, the demographic groups most similar to Immigrants from South Africa are Immigrants from Syria (29.4%, a difference of 0.020%), Norwegian (29.3%, a difference of 0.040%), Immigrants from Denmark (29.4%, a difference of 0.26%), Luxembourger (29.4%, a difference of 0.26%), and Immigrants from Vietnam (29.3%, a difference of 0.27%).
| Demographics | Rating | Rank | Births to Unmarried Women |
| Immigrants | Latvia | 96.8 /100 | #90 | Exceptional 29.1% |
| Immigrants | Fiji | 96.6 /100 | #91 | Exceptional 29.2% |
| Arabs | 96.5 /100 | #92 | Exceptional 29.2% |
| Estonians | 96.5 /100 | #93 | Exceptional 29.2% |
| Ukrainians | 96.3 /100 | #94 | Exceptional 29.2% |
| Immigrants | Vietnam | 96.1 /100 | #95 | Exceptional 29.3% |
| Norwegians | 95.8 /100 | #96 | Exceptional 29.3% |
| Immigrants | South Africa | 95.7 /100 | #97 | Exceptional 29.3% |
| Immigrants | Syria | 95.7 /100 | #98 | Exceptional 29.4% |
| Immigrants | Denmark | 95.3 /100 | #99 | Exceptional 29.4% |
| Luxembourgers | 95.2 /100 | #100 | Exceptional 29.4% |
| Immigrants | Northern Africa | 94.7 /100 | #101 | Exceptional 29.5% |
| Australians | 94.6 /100 | #102 | Exceptional 29.5% |
| Lebanese | 94.4 /100 | #103 | Exceptional 29.5% |
| Lithuanians | 94.4 /100 | #104 | Exceptional 29.6% |
Demographics Similar to Immigrants from Nicaragua by Births to Unmarried Women
In terms of births to unmarried women, the demographic groups most similar to Immigrants from Nicaragua are British West Indian (38.0%, a difference of 0.050%), Blackfeet (37.9%, a difference of 0.15%), Seminole (37.9%, a difference of 0.20%), Hispanic or Latino (37.8%, a difference of 0.54%), and Iroquois (38.2%, a difference of 0.60%).
| Demographics | Rating | Rank | Births to Unmarried Women |
| Immigrants | Guatemala | 0.0 /100 | #286 | Tragic 37.5% |
| Creek | 0.0 /100 | #287 | Tragic 37.6% |
| Immigrants | Liberia | 0.0 /100 | #288 | Tragic 37.6% |
| Alaskan Athabascans | 0.0 /100 | #289 | Tragic 37.7% |
| Hispanics or Latinos | 0.0 /100 | #290 | Tragic 37.8% |
| Seminole | 0.0 /100 | #291 | Tragic 37.9% |
| Blackfeet | 0.0 /100 | #292 | Tragic 37.9% |
| Immigrants | Nicaragua | 0.0 /100 | #293 | Tragic 38.0% |
| British West Indians | 0.0 /100 | #294 | Tragic 38.0% |
| Iroquois | 0.0 /100 | #295 | Tragic 38.2% |
| Alaska Natives | 0.0 /100 | #296 | Tragic 38.3% |
| Dutch West Indians | 0.0 /100 | #297 | Tragic 38.4% |
| Jamaicans | 0.0 /100 | #298 | Tragic 38.5% |
| Spanish Americans | 0.0 /100 | #299 | Tragic 38.6% |
| Immigrants | West Indies | 0.0 /100 | #300 | Tragic 38.6% |