Immigrants from Barbados vs Immigrants from Nicaragua College, Under 1 year
COMPARE
Immigrants from Barbados
Immigrants from Nicaragua
College, Under 1 year
College, Under 1 year Comparison
Immigrants from Barbados
Immigrants from Nicaragua
60.4%
COLLEGE, UNDER 1 YEAR
0.1/ 100
METRIC RATING
275th/ 347
METRIC RANK
57.6%
COLLEGE, UNDER 1 YEAR
0.0/ 100
METRIC RATING
309th/ 347
METRIC RANK
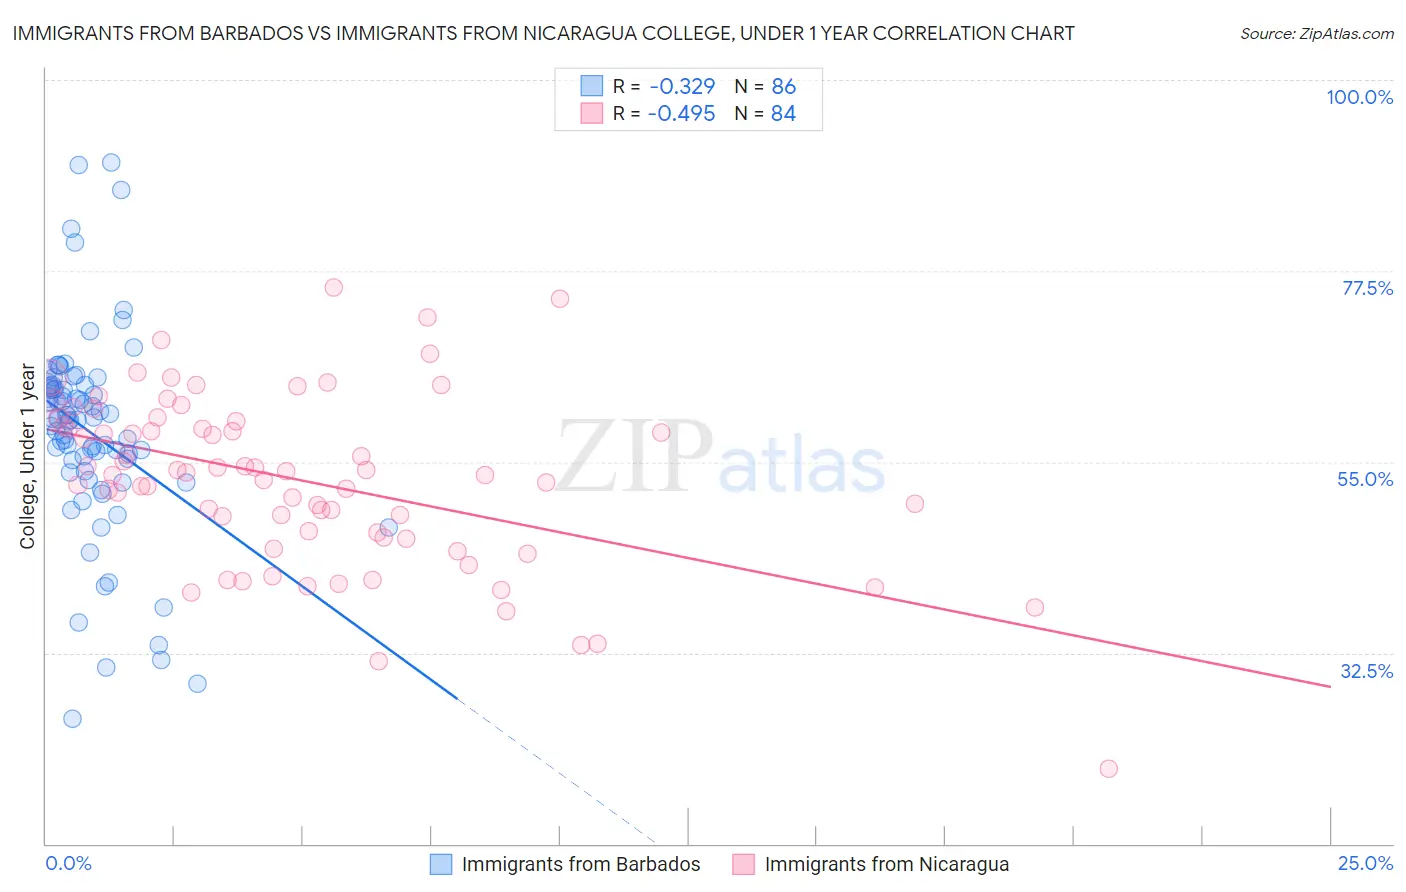
Immigrants from Barbados vs Immigrants from Nicaragua College, Under 1 year Correlation Chart
The statistical analysis conducted on geographies consisting of 112,783,541 people shows a mild negative correlation between the proportion of Immigrants from Barbados and percentage of population with at least college, under 1 year education in the United States with a correlation coefficient (R) of -0.329 and weighted average of 60.4%. Similarly, the statistical analysis conducted on geographies consisting of 236,341,850 people shows a moderate negative correlation between the proportion of Immigrants from Nicaragua and percentage of population with at least college, under 1 year education in the United States with a correlation coefficient (R) of -0.495 and weighted average of 57.6%, a difference of 4.8%.
College, Under 1 year Correlation Summary
| Measurement | Immigrants from Barbados | Immigrants from Nicaragua |
| Minimum | 24.7% | 18.9% |
| Maximum | 90.3% | 75.6% |
| Range | 65.6% | 56.7% |
| Mean | 58.4% | 52.8% |
| Median | 60.0% | 53.6% |
| Interquartile 25% (IQ1) | 53.9% | 46.4% |
| Interquartile 75% (IQ3) | 63.9% | 59.5% |
| Interquartile Range (IQR) | 10.0% | 13.2% |
| Standard Deviation (Sample) | 11.9% | 10.2% |
| Standard Deviation (Population) | 11.9% | 10.1% |
Similar Demographics by College, Under 1 year
Demographics Similar to Immigrants from Barbados by College, Under 1 year
In terms of college, under 1 year, the demographic groups most similar to Immigrants from Barbados are Arapaho (60.3%, a difference of 0.030%), Chickasaw (60.4%, a difference of 0.13%), Alaska Native (60.4%, a difference of 0.13%), Bahamian (60.3%, a difference of 0.17%), and Jamaican (60.5%, a difference of 0.18%).
| Demographics | Rating | Rank | College, Under 1 year |
| Immigrants | Trinidad and Tobago | 0.1 /100 | #268 | Tragic 60.7% |
| Immigrants | West Indies | 0.1 /100 | #269 | Tragic 60.6% |
| Cheyenne | 0.1 /100 | #270 | Tragic 60.6% |
| U.S. Virgin Islanders | 0.1 /100 | #271 | Tragic 60.6% |
| Jamaicans | 0.1 /100 | #272 | Tragic 60.5% |
| Chickasaw | 0.1 /100 | #273 | Tragic 60.4% |
| Alaska Natives | 0.1 /100 | #274 | Tragic 60.4% |
| Immigrants | Barbados | 0.1 /100 | #275 | Tragic 60.4% |
| Arapaho | 0.1 /100 | #276 | Tragic 60.3% |
| Bahamians | 0.1 /100 | #277 | Tragic 60.3% |
| Yaqui | 0.1 /100 | #278 | Tragic 60.2% |
| Ute | 0.1 /100 | #279 | Tragic 60.2% |
| Crow | 0.1 /100 | #280 | Tragic 60.2% |
| Cherokee | 0.1 /100 | #281 | Tragic 60.1% |
| Belizeans | 0.1 /100 | #282 | Tragic 60.1% |
Demographics Similar to Immigrants from Nicaragua by College, Under 1 year
In terms of college, under 1 year, the demographic groups most similar to Immigrants from Nicaragua are Fijian (57.7%, a difference of 0.12%), Central American (57.7%, a difference of 0.12%), Immigrants from Portugal (57.7%, a difference of 0.14%), Haitian (57.8%, a difference of 0.33%), and Pueblo (57.4%, a difference of 0.39%).
| Demographics | Rating | Rank | College, Under 1 year |
| Apache | 0.0 /100 | #302 | Tragic 58.0% |
| Immigrants | Dominica | 0.0 /100 | #303 | Tragic 57.9% |
| Kiowa | 0.0 /100 | #304 | Tragic 57.8% |
| Haitians | 0.0 /100 | #305 | Tragic 57.8% |
| Immigrants | Portugal | 0.0 /100 | #306 | Tragic 57.7% |
| Fijians | 0.0 /100 | #307 | Tragic 57.7% |
| Central Americans | 0.0 /100 | #308 | Tragic 57.7% |
| Immigrants | Nicaragua | 0.0 /100 | #309 | Tragic 57.6% |
| Pueblo | 0.0 /100 | #310 | Tragic 57.4% |
| Cajuns | 0.0 /100 | #311 | Tragic 57.3% |
| Salvadorans | 0.0 /100 | #312 | Tragic 57.3% |
| Dutch West Indians | 0.0 /100 | #313 | Tragic 57.2% |
| Hopi | 0.0 /100 | #314 | Tragic 57.1% |
| Hondurans | 0.0 /100 | #315 | Tragic 57.1% |
| Menominee | 0.0 /100 | #316 | Tragic 57.0% |