Immigrants from Dominican Republic vs Immigrants from Nicaragua College, Under 1 year
COMPARE
Immigrants from Dominican Republic
Immigrants from Nicaragua
College, Under 1 year
College, Under 1 year Comparison
Immigrants from Dominican Republic
Immigrants from Nicaragua
54.0%
COLLEGE, UNDER 1 YEAR
0.0/ 100
METRIC RATING
339th/ 347
METRIC RANK
57.6%
COLLEGE, UNDER 1 YEAR
0.0/ 100
METRIC RATING
309th/ 347
METRIC RANK
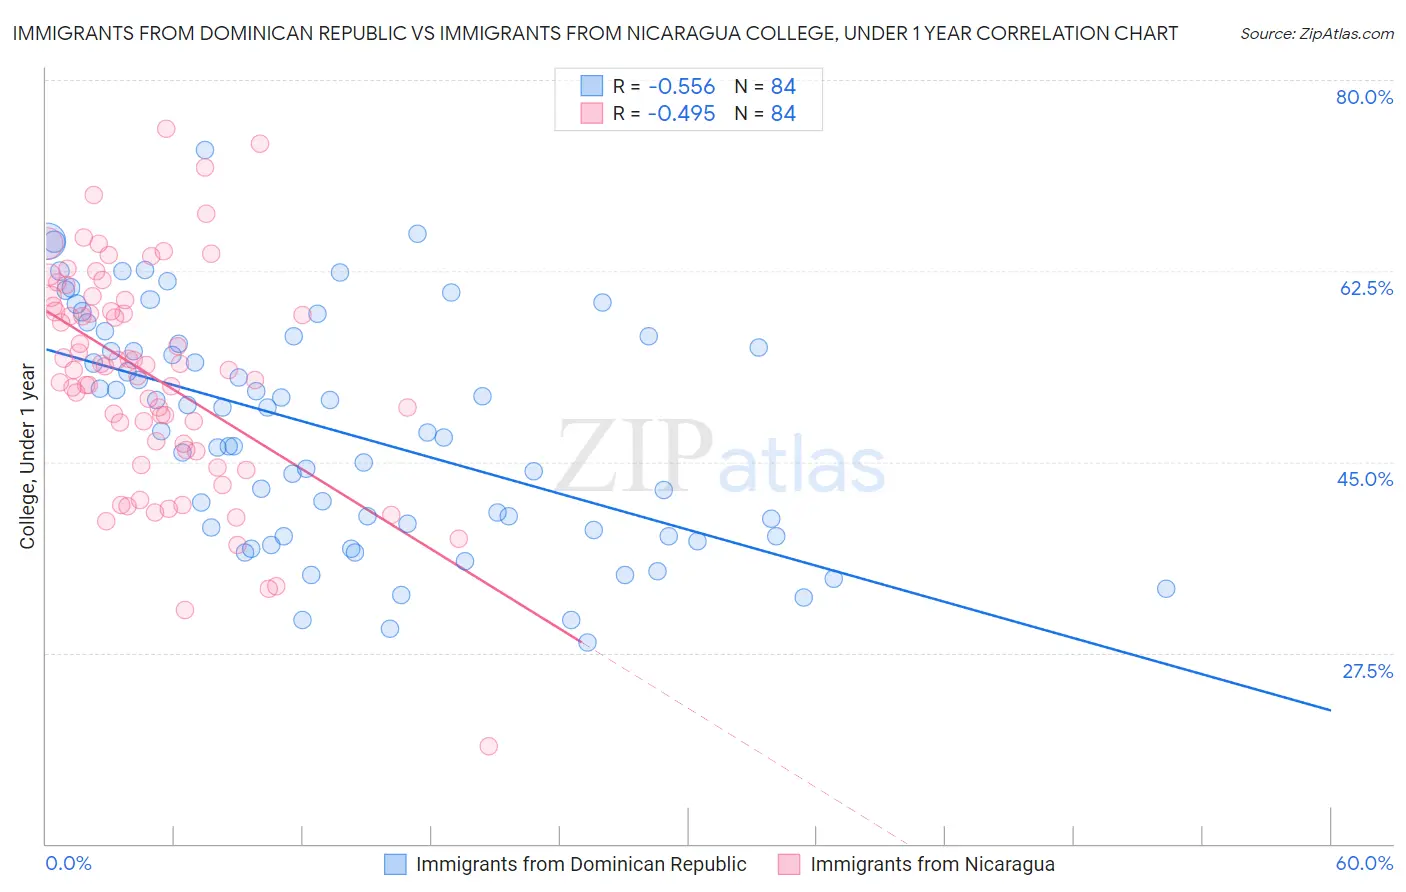
Immigrants from Dominican Republic vs Immigrants from Nicaragua College, Under 1 year Correlation Chart
The statistical analysis conducted on geographies consisting of 275,143,955 people shows a substantial negative correlation between the proportion of Immigrants from Dominican Republic and percentage of population with at least college, under 1 year education in the United States with a correlation coefficient (R) of -0.556 and weighted average of 54.0%. Similarly, the statistical analysis conducted on geographies consisting of 236,341,850 people shows a moderate negative correlation between the proportion of Immigrants from Nicaragua and percentage of population with at least college, under 1 year education in the United States with a correlation coefficient (R) of -0.495 and weighted average of 57.6%, a difference of 6.7%.
College, Under 1 year Correlation Summary
| Measurement | Immigrants from Dominican Republic | Immigrants from Nicaragua |
| Minimum | 28.4% | 18.9% |
| Maximum | 73.5% | 75.6% |
| Range | 45.1% | 56.7% |
| Mean | 47.8% | 52.8% |
| Median | 47.7% | 53.6% |
| Interquartile 25% (IQ1) | 38.5% | 46.4% |
| Interquartile 75% (IQ3) | 56.2% | 59.5% |
| Interquartile Range (IQR) | 17.7% | 13.2% |
| Standard Deviation (Sample) | 10.5% | 10.2% |
| Standard Deviation (Population) | 10.4% | 10.1% |
Similar Demographics by College, Under 1 year
Demographics Similar to Immigrants from Dominican Republic by College, Under 1 year
In terms of college, under 1 year, the demographic groups most similar to Immigrants from Dominican Republic are Spanish American Indian (54.0%, a difference of 0.090%), Lumbee (54.2%, a difference of 0.40%), Immigrants from Cabo Verde (53.7%, a difference of 0.59%), Immigrants from Mexico (53.7%, a difference of 0.65%), and Immigrants from Central America (54.4%, a difference of 0.81%).
| Demographics | Rating | Rank | College, Under 1 year |
| Immigrants | Yemen | 0.0 /100 | #332 | Tragic 55.3% |
| Yuman | 0.0 /100 | #333 | Tragic 55.1% |
| Immigrants | Azores | 0.0 /100 | #334 | Tragic 54.7% |
| Inupiat | 0.0 /100 | #335 | Tragic 54.6% |
| Pennsylvania Germans | 0.0 /100 | #336 | Tragic 54.5% |
| Immigrants | Central America | 0.0 /100 | #337 | Tragic 54.4% |
| Lumbee | 0.0 /100 | #338 | Tragic 54.2% |
| Immigrants | Dominican Republic | 0.0 /100 | #339 | Tragic 54.0% |
| Spanish American Indians | 0.0 /100 | #340 | Tragic 54.0% |
| Immigrants | Cabo Verde | 0.0 /100 | #341 | Tragic 53.7% |
| Immigrants | Mexico | 0.0 /100 | #342 | Tragic 53.7% |
| Tohono O'odham | 0.0 /100 | #343 | Tragic 52.8% |
| Yakama | 0.0 /100 | #344 | Tragic 52.6% |
| Pima | 0.0 /100 | #345 | Tragic 51.4% |
| Houma | 0.0 /100 | #346 | Tragic 47.6% |
Demographics Similar to Immigrants from Nicaragua by College, Under 1 year
In terms of college, under 1 year, the demographic groups most similar to Immigrants from Nicaragua are Fijian (57.7%, a difference of 0.12%), Central American (57.7%, a difference of 0.12%), Immigrants from Portugal (57.7%, a difference of 0.14%), Haitian (57.8%, a difference of 0.33%), and Pueblo (57.4%, a difference of 0.39%).
| Demographics | Rating | Rank | College, Under 1 year |
| Apache | 0.0 /100 | #302 | Tragic 58.0% |
| Immigrants | Dominica | 0.0 /100 | #303 | Tragic 57.9% |
| Kiowa | 0.0 /100 | #304 | Tragic 57.8% |
| Haitians | 0.0 /100 | #305 | Tragic 57.8% |
| Immigrants | Portugal | 0.0 /100 | #306 | Tragic 57.7% |
| Fijians | 0.0 /100 | #307 | Tragic 57.7% |
| Central Americans | 0.0 /100 | #308 | Tragic 57.7% |
| Immigrants | Nicaragua | 0.0 /100 | #309 | Tragic 57.6% |
| Pueblo | 0.0 /100 | #310 | Tragic 57.4% |
| Cajuns | 0.0 /100 | #311 | Tragic 57.3% |
| Salvadorans | 0.0 /100 | #312 | Tragic 57.3% |
| Dutch West Indians | 0.0 /100 | #313 | Tragic 57.2% |
| Hopi | 0.0 /100 | #314 | Tragic 57.1% |
| Hondurans | 0.0 /100 | #315 | Tragic 57.1% |
| Menominee | 0.0 /100 | #316 | Tragic 57.0% |