Latvian vs Immigrants from Nicaragua College, Under 1 year
COMPARE
Latvian
Immigrants from Nicaragua
College, Under 1 year
College, Under 1 year Comparison
Latvians
Immigrants from Nicaragua
71.6%
COLLEGE, UNDER 1 YEAR
100.0/ 100
METRIC RATING
19th/ 347
METRIC RANK
57.6%
COLLEGE, UNDER 1 YEAR
0.0/ 100
METRIC RATING
309th/ 347
METRIC RANK
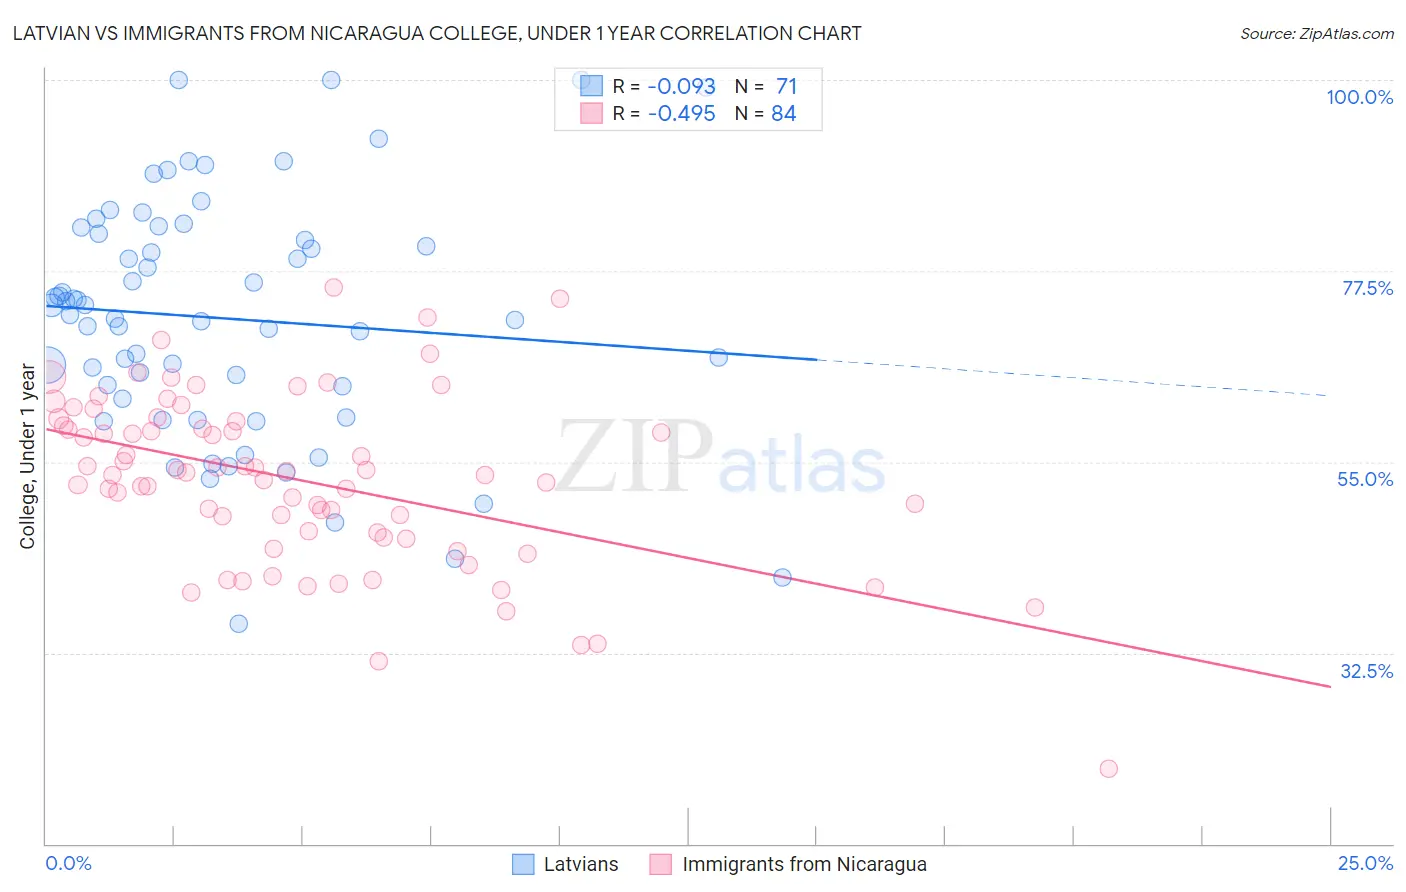
Latvian vs Immigrants from Nicaragua College, Under 1 year Correlation Chart
The statistical analysis conducted on geographies consisting of 220,726,880 people shows a slight negative correlation between the proportion of Latvians and percentage of population with at least college, under 1 year education in the United States with a correlation coefficient (R) of -0.093 and weighted average of 71.6%. Similarly, the statistical analysis conducted on geographies consisting of 236,341,850 people shows a moderate negative correlation between the proportion of Immigrants from Nicaragua and percentage of population with at least college, under 1 year education in the United States with a correlation coefficient (R) of -0.495 and weighted average of 57.6%, a difference of 24.3%.
College, Under 1 year Correlation Summary
| Measurement | Latvian | Immigrants from Nicaragua |
| Minimum | 36.0% | 18.9% |
| Maximum | 100.0% | 75.6% |
| Range | 64.0% | 56.7% |
| Mean | 71.9% | 52.8% |
| Median | 72.3% | 53.6% |
| Interquartile 25% (IQ1) | 62.5% | 46.4% |
| Interquartile 75% (IQ3) | 81.9% | 59.5% |
| Interquartile Range (IQR) | 19.4% | 13.2% |
| Standard Deviation (Sample) | 14.2% | 10.2% |
| Standard Deviation (Population) | 14.1% | 10.1% |
Similar Demographics by College, Under 1 year
Demographics Similar to Latvians by College, Under 1 year
In terms of college, under 1 year, the demographic groups most similar to Latvians are Immigrants from Korea (71.6%, a difference of 0.040%), Immigrants from Switzerland (71.7%, a difference of 0.11%), Immigrants from Belgium (71.5%, a difference of 0.19%), Eastern European (71.8%, a difference of 0.24%), and Immigrants from Japan (71.9%, a difference of 0.39%).
| Demographics | Rating | Rank | College, Under 1 year |
| Immigrants | Sweden | 100.0 /100 | #12 | Exceptional 72.1% |
| Cypriots | 100.0 /100 | #13 | Exceptional 72.0% |
| Cambodians | 100.0 /100 | #14 | Exceptional 71.9% |
| Burmese | 100.0 /100 | #15 | Exceptional 71.9% |
| Immigrants | Japan | 100.0 /100 | #16 | Exceptional 71.9% |
| Eastern Europeans | 100.0 /100 | #17 | Exceptional 71.8% |
| Immigrants | Switzerland | 100.0 /100 | #18 | Exceptional 71.7% |
| Latvians | 100.0 /100 | #19 | Exceptional 71.6% |
| Immigrants | Korea | 100.0 /100 | #20 | Exceptional 71.6% |
| Immigrants | Belgium | 100.0 /100 | #21 | Exceptional 71.5% |
| Immigrants | Eastern Asia | 100.0 /100 | #22 | Exceptional 71.3% |
| Immigrants | Northern Europe | 100.0 /100 | #23 | Exceptional 71.1% |
| Soviet Union | 100.0 /100 | #24 | Exceptional 71.1% |
| Bulgarians | 100.0 /100 | #25 | Exceptional 71.1% |
| Immigrants | Denmark | 100.0 /100 | #26 | Exceptional 71.0% |
Demographics Similar to Immigrants from Nicaragua by College, Under 1 year
In terms of college, under 1 year, the demographic groups most similar to Immigrants from Nicaragua are Fijian (57.7%, a difference of 0.12%), Central American (57.7%, a difference of 0.12%), Immigrants from Portugal (57.7%, a difference of 0.14%), Haitian (57.8%, a difference of 0.33%), and Pueblo (57.4%, a difference of 0.39%).
| Demographics | Rating | Rank | College, Under 1 year |
| Apache | 0.0 /100 | #302 | Tragic 58.0% |
| Immigrants | Dominica | 0.0 /100 | #303 | Tragic 57.9% |
| Kiowa | 0.0 /100 | #304 | Tragic 57.8% |
| Haitians | 0.0 /100 | #305 | Tragic 57.8% |
| Immigrants | Portugal | 0.0 /100 | #306 | Tragic 57.7% |
| Fijians | 0.0 /100 | #307 | Tragic 57.7% |
| Central Americans | 0.0 /100 | #308 | Tragic 57.7% |
| Immigrants | Nicaragua | 0.0 /100 | #309 | Tragic 57.6% |
| Pueblo | 0.0 /100 | #310 | Tragic 57.4% |
| Cajuns | 0.0 /100 | #311 | Tragic 57.3% |
| Salvadorans | 0.0 /100 | #312 | Tragic 57.3% |
| Dutch West Indians | 0.0 /100 | #313 | Tragic 57.2% |
| Hopi | 0.0 /100 | #314 | Tragic 57.1% |
| Hondurans | 0.0 /100 | #315 | Tragic 57.1% |
| Menominee | 0.0 /100 | #316 | Tragic 57.0% |