Immigrants from Singapore vs Greek College, 1 year or more
COMPARE
Immigrants from Singapore
Greek
College, 1 year or more
College, 1 year or more Comparison
Immigrants from Singapore
Greeks
70.1%
COLLEGE, 1 YEAR OR MORE
100.0/ 100
METRIC RATING
2nd/ 347
METRIC RANK
62.6%
COLLEGE, 1 YEAR OR MORE
98.3/ 100
METRIC RATING
88th/ 347
METRIC RANK
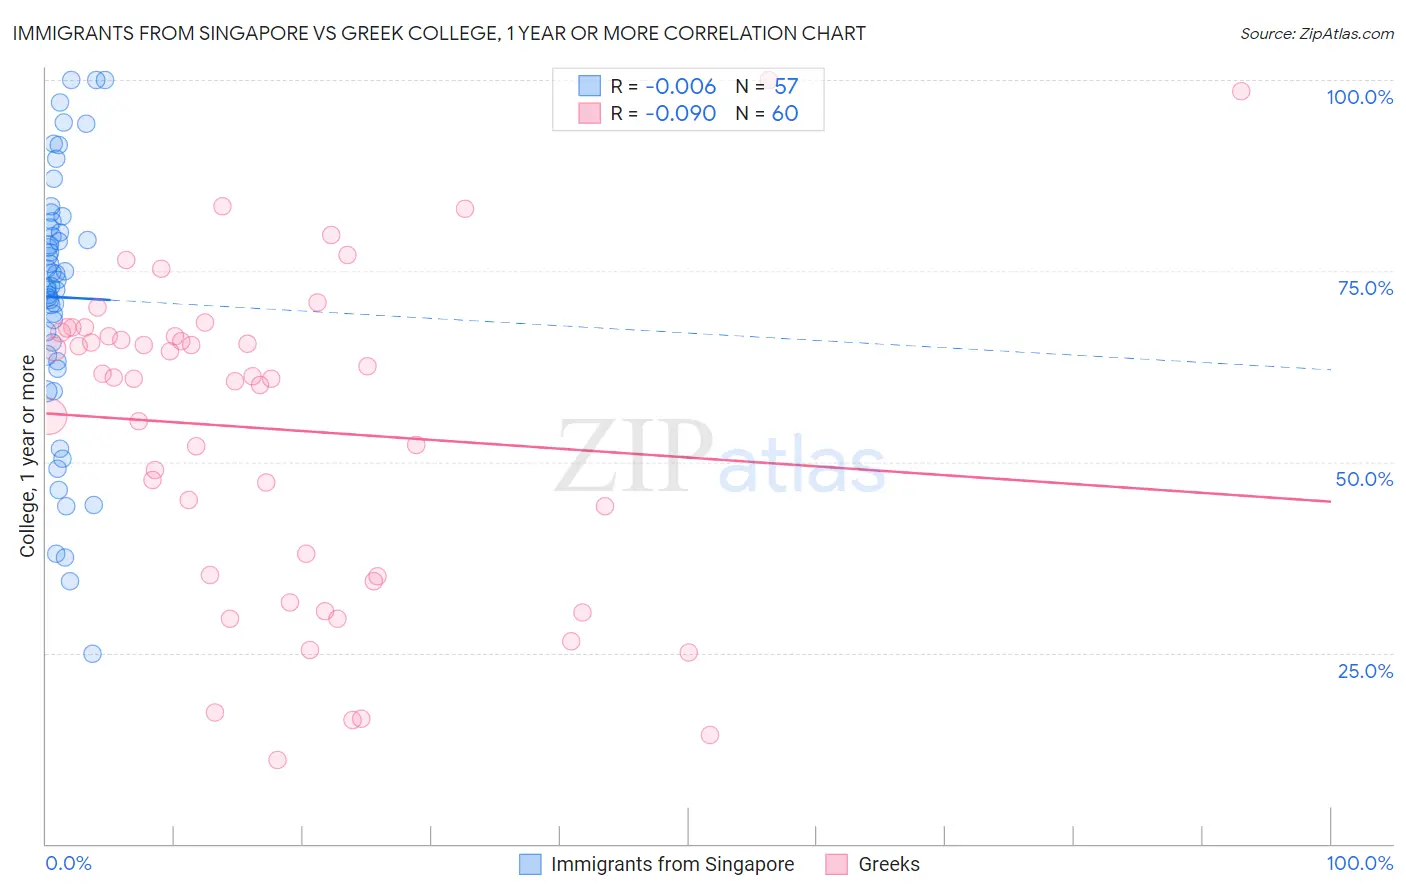
Immigrants from Singapore vs Greek College, 1 year or more Correlation Chart
The statistical analysis conducted on geographies consisting of 137,521,700 people shows no correlation between the proportion of Immigrants from Singapore and percentage of population with at least college, 1 year or more education in the United States with a correlation coefficient (R) of -0.006 and weighted average of 70.1%. Similarly, the statistical analysis conducted on geographies consisting of 482,770,265 people shows a slight negative correlation between the proportion of Greeks and percentage of population with at least college, 1 year or more education in the United States with a correlation coefficient (R) of -0.090 and weighted average of 62.6%, a difference of 12.0%.
College, 1 year or more Correlation Summary
| Measurement | Immigrants from Singapore | Greek |
| Minimum | 24.9% | 10.9% |
| Maximum | 100.0% | 100.0% |
| Range | 75.1% | 89.1% |
| Mean | 71.6% | 54.3% |
| Median | 73.8% | 61.0% |
| Interquartile 25% (IQ1) | 63.6% | 35.1% |
| Interquartile 75% (IQ3) | 81.1% | 66.7% |
| Interquartile Range (IQR) | 17.5% | 31.6% |
| Standard Deviation (Sample) | 17.1% | 20.9% |
| Standard Deviation (Population) | 17.0% | 20.8% |
Similar Demographics by College, 1 year or more
Demographics Similar to Immigrants from Singapore by College, 1 year or more
In terms of college, 1 year or more, the demographic groups most similar to Immigrants from Singapore are Iranian (70.0%, a difference of 0.22%), Immigrants from Taiwan (69.6%, a difference of 0.72%), Immigrants from India (69.6%, a difference of 0.72%), Immigrants from Iran (69.5%, a difference of 0.92%), and Filipino (71.0%, a difference of 1.2%).
| Demographics | Rating | Rank | College, 1 year or more |
| Filipinos | 100.0 /100 | #1 | Exceptional 71.0% |
| Immigrants | Singapore | 100.0 /100 | #2 | Exceptional 70.1% |
| Iranians | 100.0 /100 | #3 | Exceptional 70.0% |
| Immigrants | Taiwan | 100.0 /100 | #4 | Exceptional 69.6% |
| Immigrants | India | 100.0 /100 | #5 | Exceptional 69.6% |
| Immigrants | Iran | 100.0 /100 | #6 | Exceptional 69.5% |
| Okinawans | 100.0 /100 | #7 | Exceptional 69.0% |
| Thais | 100.0 /100 | #8 | Exceptional 68.6% |
| Immigrants | Israel | 100.0 /100 | #9 | Exceptional 67.8% |
| Immigrants | Australia | 100.0 /100 | #10 | Exceptional 67.7% |
| Immigrants | South Central Asia | 100.0 /100 | #11 | Exceptional 67.1% |
| Cypriots | 100.0 /100 | #12 | Exceptional 67.0% |
| Immigrants | Sweden | 100.0 /100 | #13 | Exceptional 66.8% |
| Burmese | 100.0 /100 | #14 | Exceptional 66.7% |
| Cambodians | 100.0 /100 | #15 | Exceptional 66.7% |
Demographics Similar to Greeks by College, 1 year or more
In terms of college, 1 year or more, the demographic groups most similar to Greeks are Immigrants from Ethiopia (62.6%, a difference of 0.10%), Immigrants from Hungary (62.7%, a difference of 0.17%), Immigrants from Western Europe (62.7%, a difference of 0.19%), Immigrants from Pakistan (62.8%, a difference of 0.21%), and Immigrants from England (62.8%, a difference of 0.22%).
| Demographics | Rating | Rank | College, 1 year or more |
| Laotians | 98.7 /100 | #81 | Exceptional 62.8% |
| Immigrants | Bolivia | 98.7 /100 | #82 | Exceptional 62.8% |
| Immigrants | Argentina | 98.6 /100 | #83 | Exceptional 62.8% |
| Immigrants | England | 98.6 /100 | #84 | Exceptional 62.8% |
| Immigrants | Pakistan | 98.6 /100 | #85 | Exceptional 62.8% |
| Immigrants | Western Europe | 98.6 /100 | #86 | Exceptional 62.7% |
| Immigrants | Hungary | 98.6 /100 | #87 | Exceptional 62.7% |
| Greeks | 98.3 /100 | #88 | Exceptional 62.6% |
| Immigrants | Ethiopia | 98.2 /100 | #89 | Exceptional 62.6% |
| Immigrants | Western Asia | 97.9 /100 | #90 | Exceptional 62.5% |
| Immigrants | Eastern Europe | 97.8 /100 | #91 | Exceptional 62.4% |
| Immigrants | Egypt | 97.8 /100 | #92 | Exceptional 62.4% |
| Romanians | 97.7 /100 | #93 | Exceptional 62.4% |
| Immigrants | Croatia | 97.6 /100 | #94 | Exceptional 62.3% |
| British | 97.4 /100 | #95 | Exceptional 62.3% |