Immigrants from Singapore vs Immigrants from Dominica College, 1 year or more
COMPARE
Immigrants from Singapore
Immigrants from Dominica
College, 1 year or more
College, 1 year or more Comparison
Immigrants from Singapore
Immigrants from Dominica
70.1%
COLLEGE, 1 YEAR OR MORE
100.0/ 100
METRIC RATING
2nd/ 347
METRIC RANK
52.5%
COLLEGE, 1 YEAR OR MORE
0.0/ 100
METRIC RATING
298th/ 347
METRIC RANK
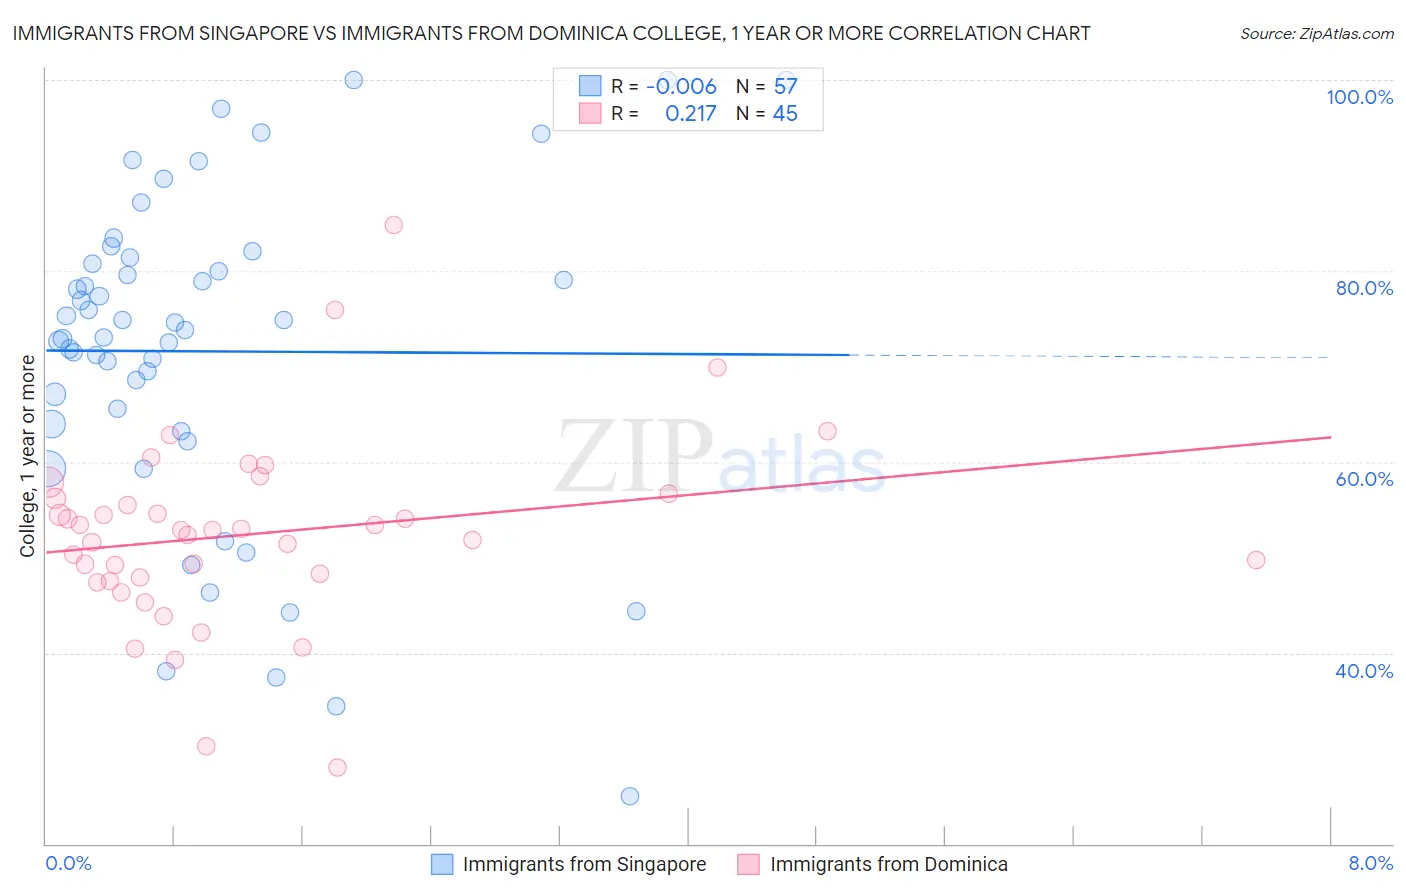
Immigrants from Singapore vs Immigrants from Dominica College, 1 year or more Correlation Chart
The statistical analysis conducted on geographies consisting of 137,521,700 people shows no correlation between the proportion of Immigrants from Singapore and percentage of population with at least college, 1 year or more education in the United States with a correlation coefficient (R) of -0.006 and weighted average of 70.1%. Similarly, the statistical analysis conducted on geographies consisting of 83,795,636 people shows a weak positive correlation between the proportion of Immigrants from Dominica and percentage of population with at least college, 1 year or more education in the United States with a correlation coefficient (R) of 0.217 and weighted average of 52.5%, a difference of 33.5%.
College, 1 year or more Correlation Summary
| Measurement | Immigrants from Singapore | Immigrants from Dominica |
| Minimum | 24.9% | 28.1% |
| Maximum | 100.0% | 84.8% |
| Range | 75.1% | 56.7% |
| Mean | 71.6% | 52.4% |
| Median | 73.8% | 52.8% |
| Interquartile 25% (IQ1) | 63.6% | 47.7% |
| Interquartile 75% (IQ3) | 81.1% | 56.4% |
| Interquartile Range (IQR) | 17.5% | 8.7% |
| Standard Deviation (Sample) | 17.1% | 10.0% |
| Standard Deviation (Population) | 17.0% | 9.9% |
Similar Demographics by College, 1 year or more
Demographics Similar to Immigrants from Singapore by College, 1 year or more
In terms of college, 1 year or more, the demographic groups most similar to Immigrants from Singapore are Iranian (70.0%, a difference of 0.22%), Immigrants from Taiwan (69.6%, a difference of 0.72%), Immigrants from India (69.6%, a difference of 0.72%), Immigrants from Iran (69.5%, a difference of 0.92%), and Filipino (71.0%, a difference of 1.2%).
| Demographics | Rating | Rank | College, 1 year or more |
| Filipinos | 100.0 /100 | #1 | Exceptional 71.0% |
| Immigrants | Singapore | 100.0 /100 | #2 | Exceptional 70.1% |
| Iranians | 100.0 /100 | #3 | Exceptional 70.0% |
| Immigrants | Taiwan | 100.0 /100 | #4 | Exceptional 69.6% |
| Immigrants | India | 100.0 /100 | #5 | Exceptional 69.6% |
| Immigrants | Iran | 100.0 /100 | #6 | Exceptional 69.5% |
| Okinawans | 100.0 /100 | #7 | Exceptional 69.0% |
| Thais | 100.0 /100 | #8 | Exceptional 68.6% |
| Immigrants | Israel | 100.0 /100 | #9 | Exceptional 67.8% |
| Immigrants | Australia | 100.0 /100 | #10 | Exceptional 67.7% |
| Immigrants | South Central Asia | 100.0 /100 | #11 | Exceptional 67.1% |
| Cypriots | 100.0 /100 | #12 | Exceptional 67.0% |
| Immigrants | Sweden | 100.0 /100 | #13 | Exceptional 66.8% |
| Burmese | 100.0 /100 | #14 | Exceptional 66.7% |
| Cambodians | 100.0 /100 | #15 | Exceptional 66.7% |
Demographics Similar to Immigrants from Dominica by College, 1 year or more
In terms of college, 1 year or more, the demographic groups most similar to Immigrants from Dominica are Immigrants from Nicaragua (52.4%, a difference of 0.34%), Choctaw (52.3%, a difference of 0.38%), Haitian (52.3%, a difference of 0.44%), Puerto Rican (52.2%, a difference of 0.57%), and Paiute (52.9%, a difference of 0.59%).
| Demographics | Rating | Rank | College, 1 year or more |
| Cubans | 0.0 /100 | #291 | Tragic 53.4% |
| Chickasaw | 0.0 /100 | #292 | Tragic 53.3% |
| Blacks/African Americans | 0.0 /100 | #293 | Tragic 53.3% |
| Cherokee | 0.0 /100 | #294 | Tragic 53.2% |
| Yaqui | 0.0 /100 | #295 | Tragic 53.2% |
| Sioux | 0.0 /100 | #296 | Tragic 53.0% |
| Paiute | 0.0 /100 | #297 | Tragic 52.9% |
| Immigrants | Dominica | 0.0 /100 | #298 | Tragic 52.5% |
| Immigrants | Nicaragua | 0.0 /100 | #299 | Tragic 52.4% |
| Choctaw | 0.0 /100 | #300 | Tragic 52.3% |
| Haitians | 0.0 /100 | #301 | Tragic 52.3% |
| Puerto Ricans | 0.0 /100 | #302 | Tragic 52.2% |
| Creek | 0.0 /100 | #303 | Tragic 52.2% |
| Central Americans | 0.0 /100 | #304 | Tragic 52.1% |
| Seminole | 0.0 /100 | #305 | Tragic 52.1% |