Immigrants from Singapore vs Pennsylvania German College, 1 year or more
COMPARE
Immigrants from Singapore
Pennsylvania German
College, 1 year or more
College, 1 year or more Comparison
Immigrants from Singapore
Pennsylvania Germans
70.1%
COLLEGE, 1 YEAR OR MORE
100.0/ 100
METRIC RATING
2nd/ 347
METRIC RANK
48.5%
COLLEGE, 1 YEAR OR MORE
0.0/ 100
METRIC RATING
337th/ 347
METRIC RANK
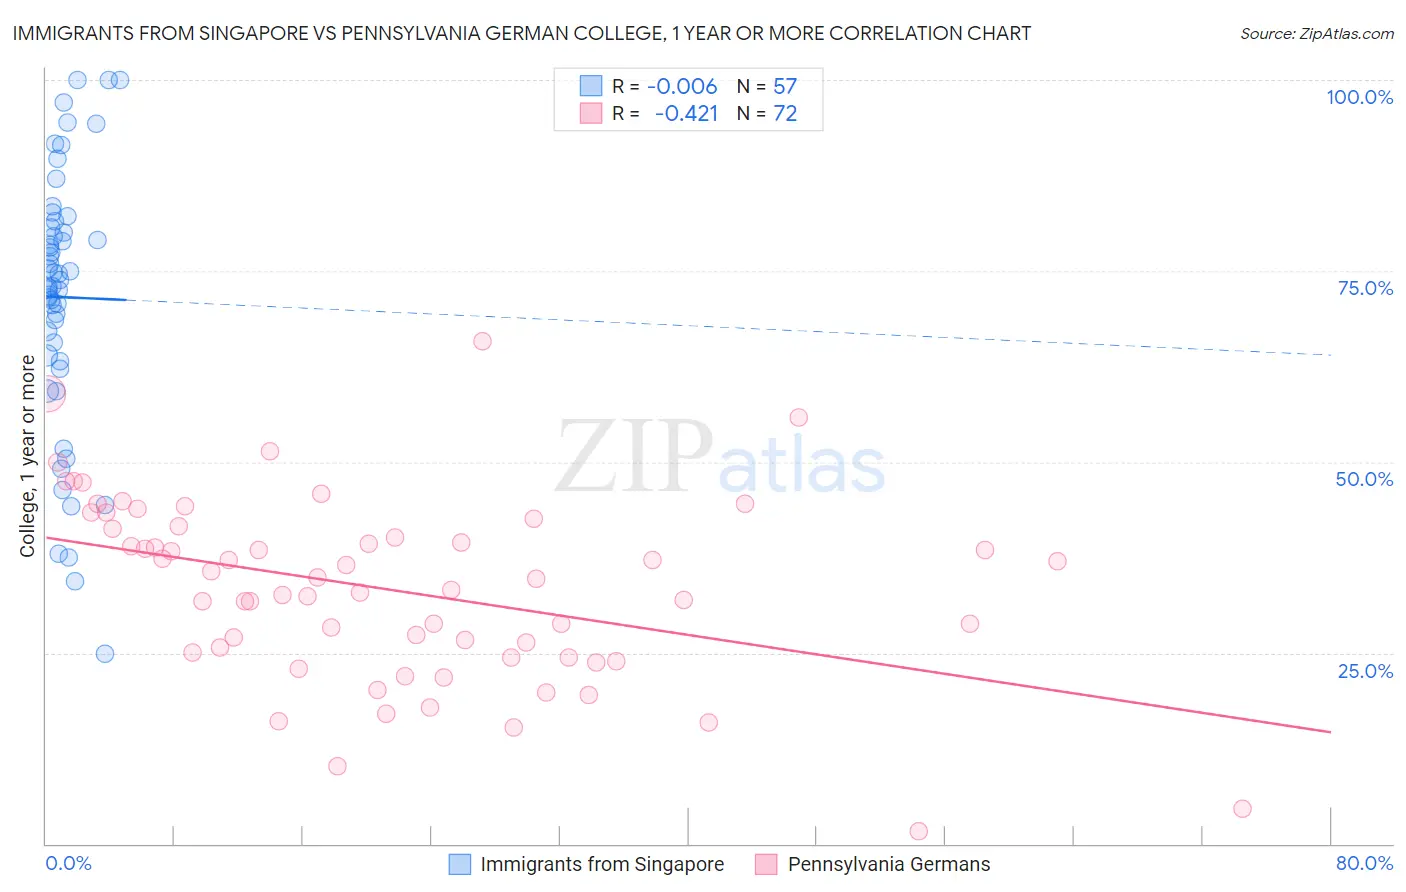
Immigrants from Singapore vs Pennsylvania German College, 1 year or more Correlation Chart
The statistical analysis conducted on geographies consisting of 137,521,700 people shows no correlation between the proportion of Immigrants from Singapore and percentage of population with at least college, 1 year or more education in the United States with a correlation coefficient (R) of -0.006 and weighted average of 70.1%. Similarly, the statistical analysis conducted on geographies consisting of 234,102,538 people shows a moderate negative correlation between the proportion of Pennsylvania Germans and percentage of population with at least college, 1 year or more education in the United States with a correlation coefficient (R) of -0.421 and weighted average of 48.5%, a difference of 44.6%.
College, 1 year or more Correlation Summary
| Measurement | Immigrants from Singapore | Pennsylvania German |
| Minimum | 24.9% | 1.6% |
| Maximum | 100.0% | 65.7% |
| Range | 75.1% | 64.2% |
| Mean | 71.6% | 33.3% |
| Median | 73.8% | 34.0% |
| Interquartile 25% (IQ1) | 63.6% | 24.7% |
| Interquartile 75% (IQ3) | 81.1% | 41.4% |
| Interquartile Range (IQR) | 17.5% | 16.7% |
| Standard Deviation (Sample) | 17.1% | 12.1% |
| Standard Deviation (Population) | 17.0% | 12.0% |
Similar Demographics by College, 1 year or more
Demographics Similar to Immigrants from Singapore by College, 1 year or more
In terms of college, 1 year or more, the demographic groups most similar to Immigrants from Singapore are Iranian (70.0%, a difference of 0.22%), Immigrants from Taiwan (69.6%, a difference of 0.72%), Immigrants from India (69.6%, a difference of 0.72%), Immigrants from Iran (69.5%, a difference of 0.92%), and Filipino (71.0%, a difference of 1.2%).
| Demographics | Rating | Rank | College, 1 year or more |
| Filipinos | 100.0 /100 | #1 | Exceptional 71.0% |
| Immigrants | Singapore | 100.0 /100 | #2 | Exceptional 70.1% |
| Iranians | 100.0 /100 | #3 | Exceptional 70.0% |
| Immigrants | Taiwan | 100.0 /100 | #4 | Exceptional 69.6% |
| Immigrants | India | 100.0 /100 | #5 | Exceptional 69.6% |
| Immigrants | Iran | 100.0 /100 | #6 | Exceptional 69.5% |
| Okinawans | 100.0 /100 | #7 | Exceptional 69.0% |
| Thais | 100.0 /100 | #8 | Exceptional 68.6% |
| Immigrants | Israel | 100.0 /100 | #9 | Exceptional 67.8% |
| Immigrants | Australia | 100.0 /100 | #10 | Exceptional 67.7% |
| Immigrants | South Central Asia | 100.0 /100 | #11 | Exceptional 67.1% |
| Cypriots | 100.0 /100 | #12 | Exceptional 67.0% |
| Immigrants | Sweden | 100.0 /100 | #13 | Exceptional 66.8% |
| Burmese | 100.0 /100 | #14 | Exceptional 66.7% |
| Cambodians | 100.0 /100 | #15 | Exceptional 66.7% |
Demographics Similar to Pennsylvania Germans by College, 1 year or more
In terms of college, 1 year or more, the demographic groups most similar to Pennsylvania Germans are Spanish American Indian (48.5%, a difference of 0.010%), Immigrants from Central America (48.5%, a difference of 0.050%), Immigrants from the Azores (48.4%, a difference of 0.31%), Yuman (48.7%, a difference of 0.45%), and Lumbee (48.9%, a difference of 0.73%).
| Demographics | Rating | Rank | College, 1 year or more |
| Natives/Alaskans | 0.0 /100 | #330 | Tragic 50.2% |
| Immigrants | Yemen | 0.0 /100 | #331 | Tragic 50.0% |
| Mexicans | 0.0 /100 | #332 | Tragic 49.2% |
| Immigrants | Dominican Republic | 0.0 /100 | #333 | Tragic 49.1% |
| Lumbee | 0.0 /100 | #334 | Tragic 48.9% |
| Yuman | 0.0 /100 | #335 | Tragic 48.7% |
| Spanish American Indians | 0.0 /100 | #336 | Tragic 48.5% |
| Pennsylvania Germans | 0.0 /100 | #337 | Tragic 48.5% |
| Immigrants | Central America | 0.0 /100 | #338 | Tragic 48.5% |
| Immigrants | Azores | 0.0 /100 | #339 | Tragic 48.4% |
| Immigrants | Cabo Verde | 0.0 /100 | #340 | Tragic 48.1% |
| Immigrants | Mexico | 0.0 /100 | #341 | Tragic 47.5% |
| Inupiat | 0.0 /100 | #342 | Tragic 47.2% |
| Tohono O'odham | 0.0 /100 | #343 | Tragic 47.1% |
| Yakama | 0.0 /100 | #344 | Tragic 46.2% |