Immigrants from Sierra Leone vs Austrian Master's Degree
COMPARE
Immigrants from Sierra Leone
Austrian
Master's Degree
Master's Degree Comparison
Immigrants from Sierra Leone
Austrians
16.3%
MASTER'S DEGREE
94.7/ 100
METRIC RATING
128th/ 347
METRIC RANK
16.7%
MASTER'S DEGREE
97.8/ 100
METRIC RATING
111th/ 347
METRIC RANK
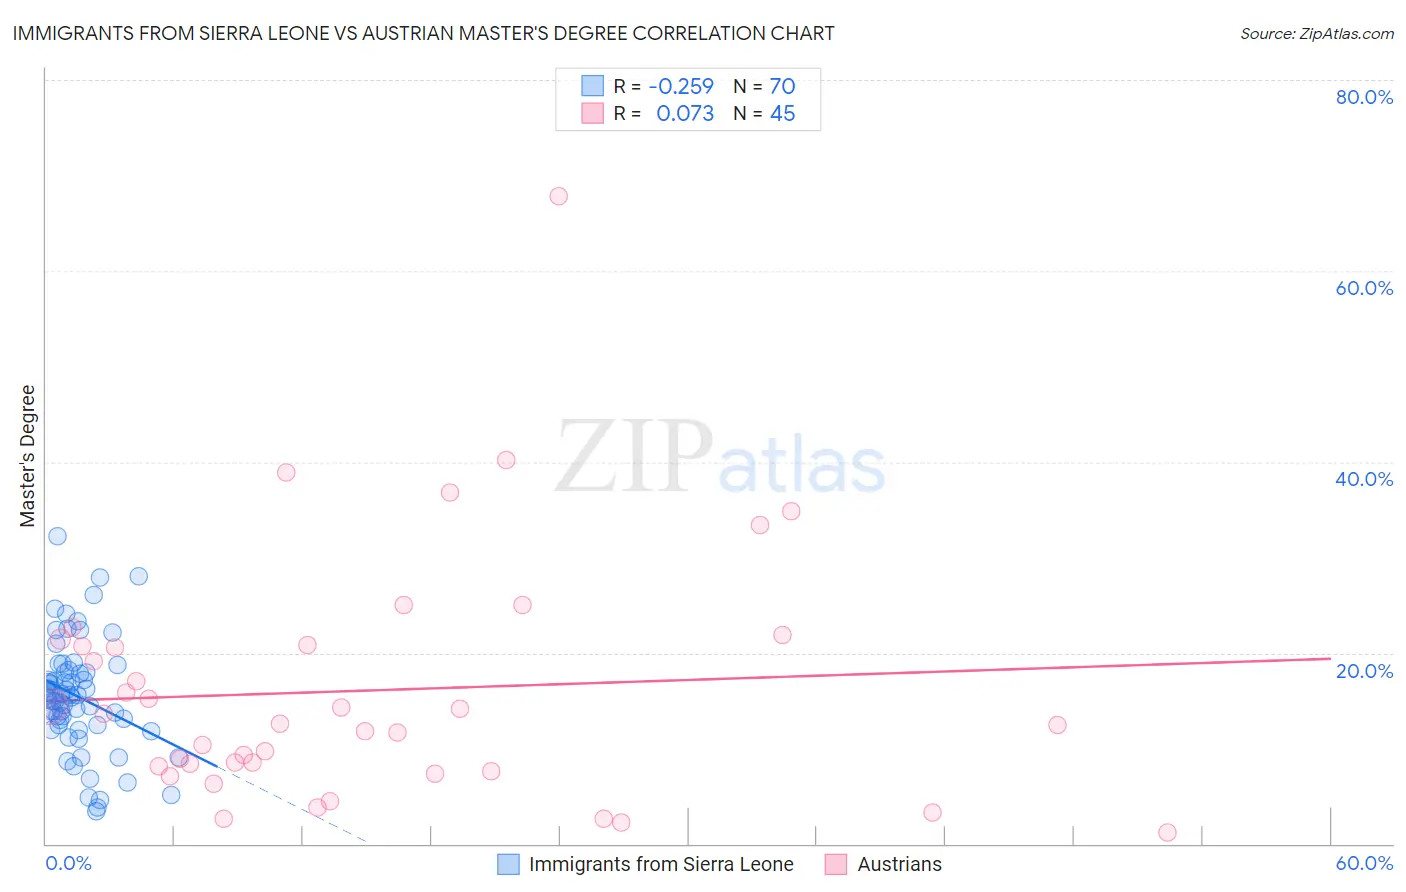
Immigrants from Sierra Leone vs Austrian Master's Degree Correlation Chart
The statistical analysis conducted on geographies consisting of 101,623,305 people shows a weak negative correlation between the proportion of Immigrants from Sierra Leone and percentage of population with at least master's degree education in the United States with a correlation coefficient (R) of -0.259 and weighted average of 16.3%. Similarly, the statistical analysis conducted on geographies consisting of 451,930,170 people shows a slight positive correlation between the proportion of Austrians and percentage of population with at least master's degree education in the United States with a correlation coefficient (R) of 0.073 and weighted average of 16.7%, a difference of 2.6%.
Master's Degree Correlation Summary
| Measurement | Immigrants from Sierra Leone | Austrian |
| Minimum | 3.4% | 1.2% |
| Maximum | 32.2% | 67.9% |
| Range | 28.9% | 66.7% |
| Mean | 15.4% | 16.1% |
| Median | 15.4% | 12.6% |
| Interquartile 25% (IQ1) | 12.4% | 7.9% |
| Interquartile 75% (IQ3) | 18.0% | 21.1% |
| Interquartile Range (IQR) | 5.6% | 13.2% |
| Standard Deviation (Sample) | 5.9% | 12.8% |
| Standard Deviation (Population) | 5.8% | 12.7% |
Demographics Similar to Immigrants from Sierra Leone and Austrians by Master's Degree
In terms of master's degree, the demographic groups most similar to Immigrants from Sierra Leone are Palestinian (16.3%, a difference of 0.050%), Immigrants from Eastern Africa (16.3%, a difference of 0.31%), Italian (16.4%, a difference of 0.42%), Immigrants from Eritrea (16.4%, a difference of 0.50%), and Croatian (16.4%, a difference of 0.57%). Similarly, the demographic groups most similar to Austrians are Macedonian (16.7%, a difference of 0.14%), Arab (16.7%, a difference of 0.15%), Northern European (16.7%, a difference of 0.22%), Immigrants from Chile (16.8%, a difference of 0.27%), and Moroccan (16.8%, a difference of 0.30%).
| Demographics | Rating | Rank | Master's Degree |
| Moroccans | 98.0 /100 | #109 | Exceptional 16.8% |
| Immigrants | Chile | 98.0 /100 | #110 | Exceptional 16.8% |
| Austrians | 97.8 /100 | #111 | Exceptional 16.7% |
| Macedonians | 97.7 /100 | #112 | Exceptional 16.7% |
| Arabs | 97.7 /100 | #113 | Exceptional 16.7% |
| Northern Europeans | 97.6 /100 | #114 | Exceptional 16.7% |
| Immigrants | Uganda | 97.3 /100 | #115 | Exceptional 16.6% |
| Immigrants | Southern Europe | 97.2 /100 | #116 | Exceptional 16.6% |
| Immigrants | Moldova | 97.2 /100 | #117 | Exceptional 16.6% |
| Brazilians | 96.8 /100 | #118 | Exceptional 16.5% |
| Jordanians | 96.5 /100 | #119 | Exceptional 16.5% |
| Lebanese | 96.4 /100 | #120 | Exceptional 16.5% |
| Afghans | 96.2 /100 | #121 | Exceptional 16.5% |
| British | 95.6 /100 | #122 | Exceptional 16.4% |
| Croatians | 95.6 /100 | #123 | Exceptional 16.4% |
| Immigrants | Eritrea | 95.5 /100 | #124 | Exceptional 16.4% |
| Italians | 95.4 /100 | #125 | Exceptional 16.4% |
| Immigrants | Eastern Africa | 95.2 /100 | #126 | Exceptional 16.3% |
| Palestinians | 94.8 /100 | #127 | Exceptional 16.3% |
| Immigrants | Sierra Leone | 94.7 /100 | #128 | Exceptional 16.3% |
| Immigrants | Syria | 93.3 /100 | #129 | Exceptional 16.2% |