Immigrants from Sierra Leone vs Jordanian Master's Degree
COMPARE
Immigrants from Sierra Leone
Jordanian
Master's Degree
Master's Degree Comparison
Immigrants from Sierra Leone
Jordanians
16.3%
MASTER'S DEGREE
94.7/ 100
METRIC RATING
128th/ 347
METRIC RANK
16.5%
MASTER'S DEGREE
96.5/ 100
METRIC RATING
119th/ 347
METRIC RANK
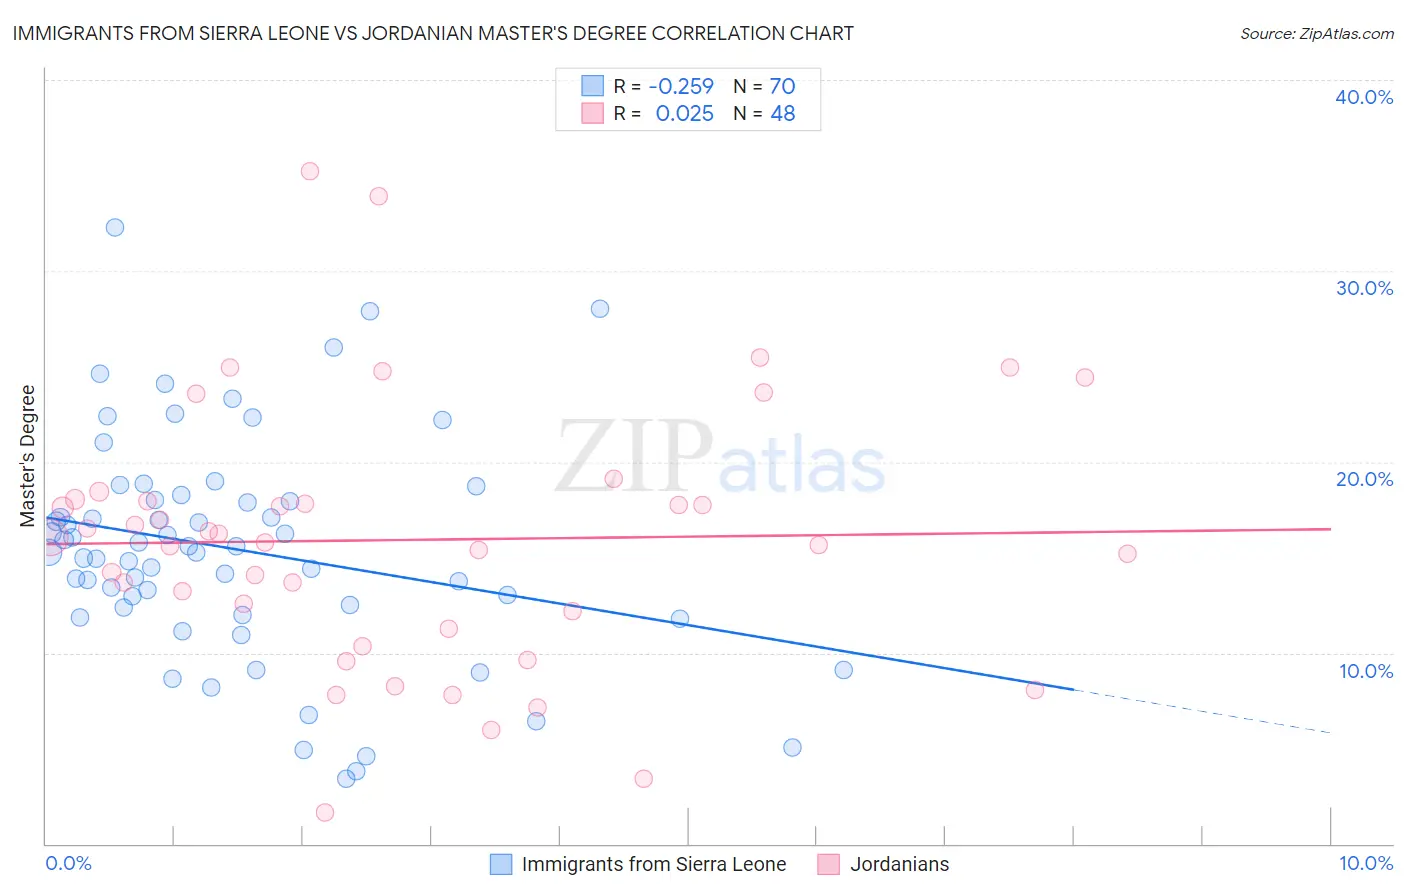
Immigrants from Sierra Leone vs Jordanian Master's Degree Correlation Chart
The statistical analysis conducted on geographies consisting of 101,623,305 people shows a weak negative correlation between the proportion of Immigrants from Sierra Leone and percentage of population with at least master's degree education in the United States with a correlation coefficient (R) of -0.259 and weighted average of 16.3%. Similarly, the statistical analysis conducted on geographies consisting of 166,405,589 people shows no correlation between the proportion of Jordanians and percentage of population with at least master's degree education in the United States with a correlation coefficient (R) of 0.025 and weighted average of 16.5%, a difference of 1.3%.
Master's Degree Correlation Summary
| Measurement | Immigrants from Sierra Leone | Jordanian |
| Minimum | 3.4% | 1.6% |
| Maximum | 32.2% | 35.2% |
| Range | 28.9% | 33.6% |
| Mean | 15.4% | 15.9% |
| Median | 15.4% | 15.9% |
| Interquartile 25% (IQ1) | 12.4% | 11.7% |
| Interquartile 75% (IQ3) | 18.0% | 18.0% |
| Interquartile Range (IQR) | 5.6% | 6.3% |
| Standard Deviation (Sample) | 5.9% | 6.9% |
| Standard Deviation (Population) | 5.8% | 6.8% |
Demographics Similar to Immigrants from Sierra Leone and Jordanians by Master's Degree
In terms of master's degree, the demographic groups most similar to Immigrants from Sierra Leone are Palestinian (16.3%, a difference of 0.050%), Immigrants from Eastern Africa (16.3%, a difference of 0.31%), Italian (16.4%, a difference of 0.42%), Immigrants from Eritrea (16.4%, a difference of 0.50%), and Croatian (16.4%, a difference of 0.57%). Similarly, the demographic groups most similar to Jordanians are Lebanese (16.5%, a difference of 0.10%), Brazilian (16.5%, a difference of 0.23%), Afghan (16.5%, a difference of 0.30%), Immigrants from Moldova (16.6%, a difference of 0.65%), and Immigrants from Southern Europe (16.6%, a difference of 0.66%).
| Demographics | Rating | Rank | Master's Degree |
| Arabs | 97.7 /100 | #113 | Exceptional 16.7% |
| Northern Europeans | 97.6 /100 | #114 | Exceptional 16.7% |
| Immigrants | Uganda | 97.3 /100 | #115 | Exceptional 16.6% |
| Immigrants | Southern Europe | 97.2 /100 | #116 | Exceptional 16.6% |
| Immigrants | Moldova | 97.2 /100 | #117 | Exceptional 16.6% |
| Brazilians | 96.8 /100 | #118 | Exceptional 16.5% |
| Jordanians | 96.5 /100 | #119 | Exceptional 16.5% |
| Lebanese | 96.4 /100 | #120 | Exceptional 16.5% |
| Afghans | 96.2 /100 | #121 | Exceptional 16.5% |
| British | 95.6 /100 | #122 | Exceptional 16.4% |
| Croatians | 95.6 /100 | #123 | Exceptional 16.4% |
| Immigrants | Eritrea | 95.5 /100 | #124 | Exceptional 16.4% |
| Italians | 95.4 /100 | #125 | Exceptional 16.4% |
| Immigrants | Eastern Africa | 95.2 /100 | #126 | Exceptional 16.3% |
| Palestinians | 94.8 /100 | #127 | Exceptional 16.3% |
| Immigrants | Sierra Leone | 94.7 /100 | #128 | Exceptional 16.3% |
| Immigrants | Syria | 93.3 /100 | #129 | Exceptional 16.2% |
| Immigrants | Jordan | 92.7 /100 | #130 | Exceptional 16.1% |
| Taiwanese | 91.9 /100 | #131 | Exceptional 16.1% |
| Serbians | 91.7 /100 | #132 | Exceptional 16.1% |
| Immigrants | Sudan | 90.2 /100 | #133 | Exceptional 16.0% |