Immigrants from Sierra Leone vs Okinawan Master's Degree
COMPARE
Immigrants from Sierra Leone
Okinawan
Master's Degree
Master's Degree Comparison
Immigrants from Sierra Leone
Okinawans
16.3%
MASTER'S DEGREE
94.7/ 100
METRIC RATING
128th/ 347
METRIC RANK
22.6%
MASTER'S DEGREE
100.0/ 100
METRIC RATING
4th/ 347
METRIC RANK
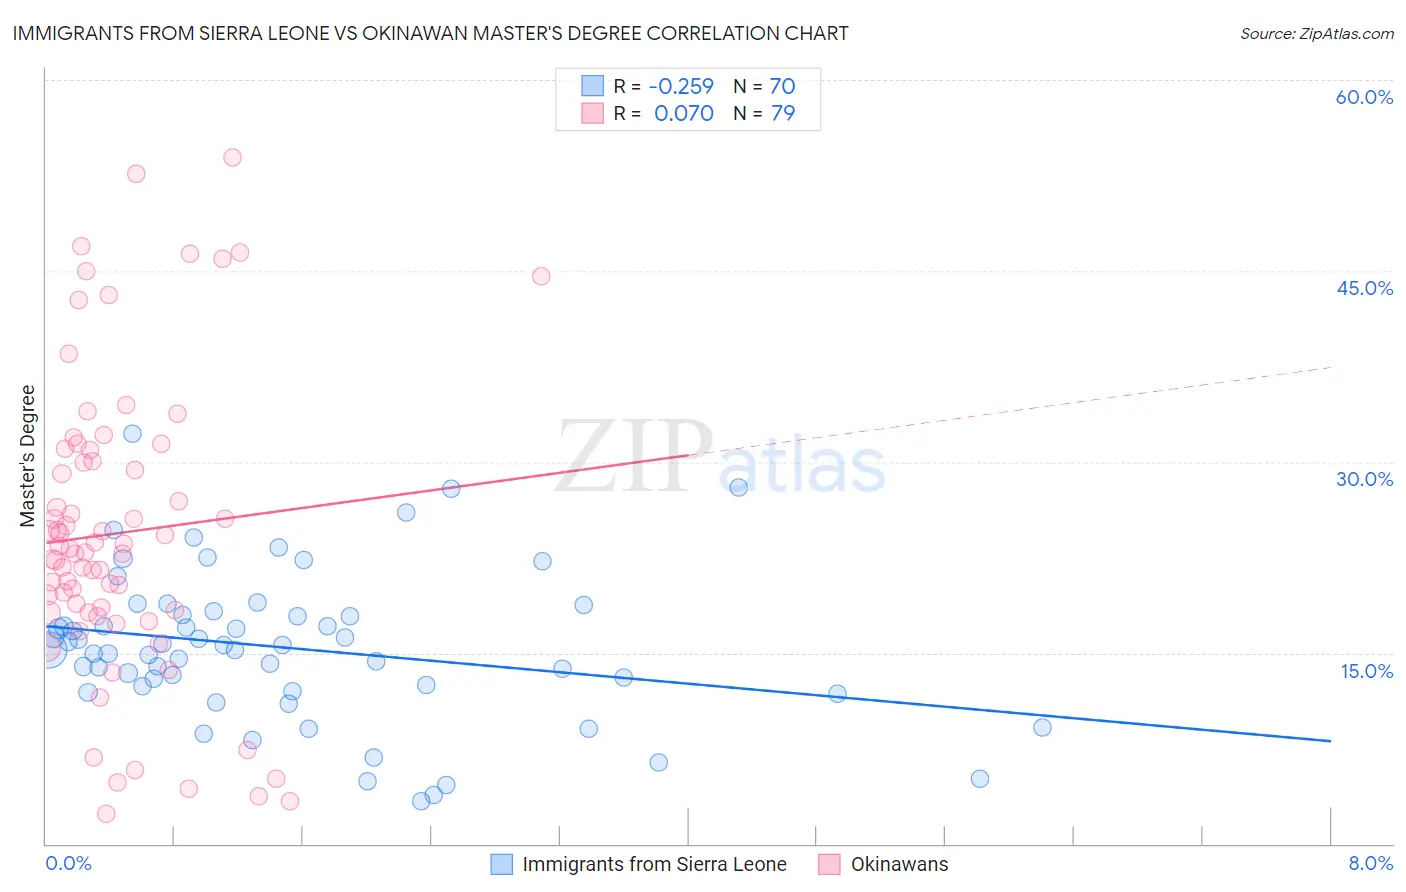
Immigrants from Sierra Leone vs Okinawan Master's Degree Correlation Chart
The statistical analysis conducted on geographies consisting of 101,623,305 people shows a weak negative correlation between the proportion of Immigrants from Sierra Leone and percentage of population with at least master's degree education in the United States with a correlation coefficient (R) of -0.259 and weighted average of 16.3%. Similarly, the statistical analysis conducted on geographies consisting of 73,758,336 people shows a slight positive correlation between the proportion of Okinawans and percentage of population with at least master's degree education in the United States with a correlation coefficient (R) of 0.070 and weighted average of 22.6%, a difference of 39.0%.
Master's Degree Correlation Summary
| Measurement | Immigrants from Sierra Leone | Okinawan |
| Minimum | 3.4% | 2.3% |
| Maximum | 32.2% | 53.9% |
| Range | 28.9% | 51.6% |
| Mean | 15.4% | 24.4% |
| Median | 15.4% | 23.2% |
| Interquartile 25% (IQ1) | 12.4% | 18.2% |
| Interquartile 75% (IQ3) | 18.0% | 30.9% |
| Interquartile Range (IQR) | 5.6% | 12.8% |
| Standard Deviation (Sample) | 5.9% | 11.7% |
| Standard Deviation (Population) | 5.8% | 11.6% |
Similar Demographics by Master's Degree
Demographics Similar to Immigrants from Sierra Leone by Master's Degree
In terms of master's degree, the demographic groups most similar to Immigrants from Sierra Leone are Palestinian (16.3%, a difference of 0.050%), Immigrants from Eastern Africa (16.3%, a difference of 0.31%), Italian (16.4%, a difference of 0.42%), Immigrants from Eritrea (16.4%, a difference of 0.50%), and Croatian (16.4%, a difference of 0.57%).
| Demographics | Rating | Rank | Master's Degree |
| Afghans | 96.2 /100 | #121 | Exceptional 16.5% |
| British | 95.6 /100 | #122 | Exceptional 16.4% |
| Croatians | 95.6 /100 | #123 | Exceptional 16.4% |
| Immigrants | Eritrea | 95.5 /100 | #124 | Exceptional 16.4% |
| Italians | 95.4 /100 | #125 | Exceptional 16.4% |
| Immigrants | Eastern Africa | 95.2 /100 | #126 | Exceptional 16.3% |
| Palestinians | 94.8 /100 | #127 | Exceptional 16.3% |
| Immigrants | Sierra Leone | 94.7 /100 | #128 | Exceptional 16.3% |
| Immigrants | Syria | 93.3 /100 | #129 | Exceptional 16.2% |
| Immigrants | Jordan | 92.7 /100 | #130 | Exceptional 16.1% |
| Taiwanese | 91.9 /100 | #131 | Exceptional 16.1% |
| Serbians | 91.7 /100 | #132 | Exceptional 16.1% |
| Immigrants | Sudan | 90.2 /100 | #133 | Exceptional 16.0% |
| Venezuelans | 88.4 /100 | #134 | Excellent 15.9% |
| South American Indians | 88.4 /100 | #135 | Excellent 15.9% |
Demographics Similar to Okinawans by Master's Degree
In terms of master's degree, the demographic groups most similar to Okinawans are Immigrants from Israel (22.6%, a difference of 0.0%), Immigrants from Taiwan (22.5%, a difference of 0.80%), Immigrants from India (22.3%, a difference of 1.5%), Iranian (22.3%, a difference of 1.7%), and Filipino (23.4%, a difference of 3.4%).
| Demographics | Rating | Rank | Master's Degree |
| Immigrants | Singapore | 100.0 /100 | #1 | Exceptional 23.4% |
| Filipinos | 100.0 /100 | #2 | Exceptional 23.4% |
| Immigrants | Israel | 100.0 /100 | #3 | Exceptional 22.6% |
| Okinawans | 100.0 /100 | #4 | Exceptional 22.6% |
| Immigrants | Taiwan | 100.0 /100 | #5 | Exceptional 22.5% |
| Immigrants | India | 100.0 /100 | #6 | Exceptional 22.3% |
| Iranians | 100.0 /100 | #7 | Exceptional 22.3% |
| Cypriots | 100.0 /100 | #8 | Exceptional 21.8% |
| Thais | 100.0 /100 | #9 | Exceptional 21.7% |
| Immigrants | Iran | 100.0 /100 | #10 | Exceptional 21.6% |
| Immigrants | China | 100.0 /100 | #11 | Exceptional 21.2% |
| Eastern Europeans | 100.0 /100 | #12 | Exceptional 21.1% |
| Immigrants | Australia | 100.0 /100 | #13 | Exceptional 20.9% |
| Immigrants | Switzerland | 100.0 /100 | #14 | Exceptional 20.9% |
| Immigrants | Eastern Asia | 100.0 /100 | #15 | Exceptional 20.8% |