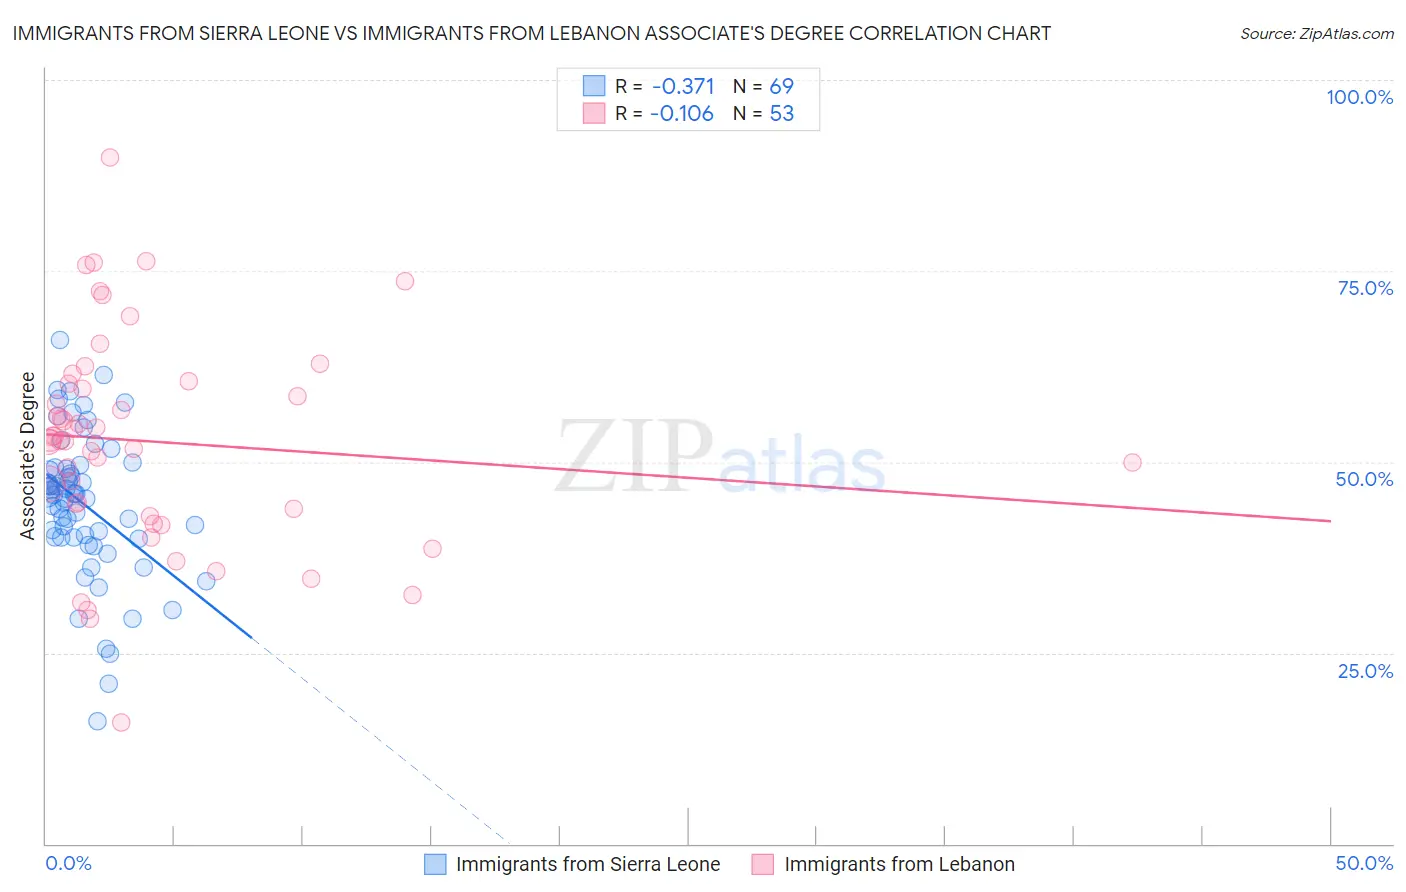
Immigrants from Sierra Leone vs Immigrants from Lebanon Associate's Degree
COMPARE
Immigrants from Sierra Leone
Immigrants from Lebanon
Associate's Degree
Associate's Degree Comparison
Immigrants from Sierra Leone
Immigrants from Lebanon
46.7%
ASSOCIATE'S DEGREE
59.2/ 100
METRIC RATING
167th/ 347
METRIC RANK
50.5%
ASSOCIATE'S DEGREE
99.1/ 100
METRIC RATING
77th/ 347
METRIC RANK
Immigrants from Sierra Leone vs Immigrants from Lebanon Associate's Degree Correlation Chart
The statistical analysis conducted on geographies consisting of 101,624,736 people shows a mild negative correlation between the proportion of Immigrants from Sierra Leone and percentage of population with at least associate's degree education in the United States with a correlation coefficient (R) of -0.371 and weighted average of 46.7%. Similarly, the statistical analysis conducted on geographies consisting of 217,164,247 people shows a poor negative correlation between the proportion of Immigrants from Lebanon and percentage of population with at least associate's degree education in the United States with a correlation coefficient (R) of -0.106 and weighted average of 50.5%, a difference of 8.1%.
Associate's Degree Correlation Summary
| Measurement | Immigrants from Sierra Leone | Immigrants from Lebanon |
| Minimum | 16.1% | 15.9% |
| Maximum | 66.0% | 89.8% |
| Range | 50.0% | 73.9% |
| Mean | 44.5% | 52.7% |
| Median | 45.7% | 52.8% |
| Interquartile 25% (IQ1) | 40.1% | 43.4% |
| Interquartile 75% (IQ3) | 49.2% | 60.5% |
| Interquartile Range (IQR) | 9.1% | 17.1% |
| Standard Deviation (Sample) | 9.5% | 14.1% |
| Standard Deviation (Population) | 9.4% | 13.9% |
Similar Demographics by Associate's Degree
Demographics Similar to Immigrants from Sierra Leone by Associate's Degree
In terms of associate's degree, the demographic groups most similar to Immigrants from Sierra Leone are Hungarian (46.7%, a difference of 0.010%), Immigrants from South America (46.7%, a difference of 0.050%), Colombian (46.8%, a difference of 0.25%), Somali (46.8%, a difference of 0.26%), and Immigrants from Somalia (46.5%, a difference of 0.29%).
| Demographics | Rating | Rank | Associate's Degree |
| Scottish | 65.4 /100 | #160 | Good 46.9% |
| Scandinavians | 65.2 /100 | #161 | Good 46.9% |
| Immigrants | Africa | 63.2 /100 | #162 | Good 46.8% |
| Somalis | 62.5 /100 | #163 | Good 46.8% |
| Colombians | 62.4 /100 | #164 | Good 46.8% |
| Immigrants | South America | 59.9 /100 | #165 | Average 46.7% |
| Hungarians | 59.3 /100 | #166 | Average 46.7% |
| Immigrants | Sierra Leone | 59.2 /100 | #167 | Average 46.7% |
| Immigrants | Somalia | 55.5 /100 | #168 | Average 46.5% |
| Uruguayans | 55.4 /100 | #169 | Average 46.5% |
| Irish | 53.6 /100 | #170 | Average 46.5% |
| Basques | 52.8 /100 | #171 | Average 46.5% |
| Peruvians | 50.5 /100 | #172 | Average 46.4% |
| Immigrants | Iraq | 50.3 /100 | #173 | Average 46.4% |
| English | 50.0 /100 | #174 | Average 46.4% |
Demographics Similar to Immigrants from Lebanon by Associate's Degree
In terms of associate's degree, the demographic groups most similar to Immigrants from Lebanon are Immigrants from Zimbabwe (50.5%, a difference of 0.030%), Immigrants from Eastern Europe (50.5%, a difference of 0.040%), Ethiopian (50.4%, a difference of 0.060%), Armenian (50.4%, a difference of 0.090%), and Maltese (50.4%, a difference of 0.16%).
| Demographics | Rating | Rank | Associate's Degree |
| Immigrants | Argentina | 99.5 /100 | #70 | Exceptional 50.9% |
| Immigrants | Romania | 99.5 /100 | #71 | Exceptional 50.9% |
| Immigrants | Pakistan | 99.5 /100 | #72 | Exceptional 50.9% |
| Carpatho Rusyns | 99.3 /100 | #73 | Exceptional 50.6% |
| Lithuanians | 99.3 /100 | #74 | Exceptional 50.6% |
| Immigrants | Scotland | 99.3 /100 | #75 | Exceptional 50.6% |
| Immigrants | Zimbabwe | 99.2 /100 | #76 | Exceptional 50.5% |
| Immigrants | Lebanon | 99.1 /100 | #77 | Exceptional 50.5% |
| Immigrants | Eastern Europe | 99.1 /100 | #78 | Exceptional 50.5% |
| Ethiopians | 99.1 /100 | #79 | Exceptional 50.4% |
| Armenians | 99.1 /100 | #80 | Exceptional 50.4% |
| Maltese | 99.1 /100 | #81 | Exceptional 50.4% |
| Greeks | 98.9 /100 | #82 | Exceptional 50.3% |
| Immigrants | Uzbekistan | 98.9 /100 | #83 | Exceptional 50.3% |
| Immigrants | Hungary | 98.9 /100 | #84 | Exceptional 50.2% |