Immigrants from Sierra Leone vs Cambodian Associate's Degree
COMPARE
Immigrants from Sierra Leone
Cambodian
Associate's Degree
Associate's Degree Comparison
Immigrants from Sierra Leone
Cambodians
46.7%
ASSOCIATE'S DEGREE
59.2/ 100
METRIC RATING
167th/ 347
METRIC RANK
54.6%
ASSOCIATE'S DEGREE
100.0/ 100
METRIC RATING
20th/ 347
METRIC RANK
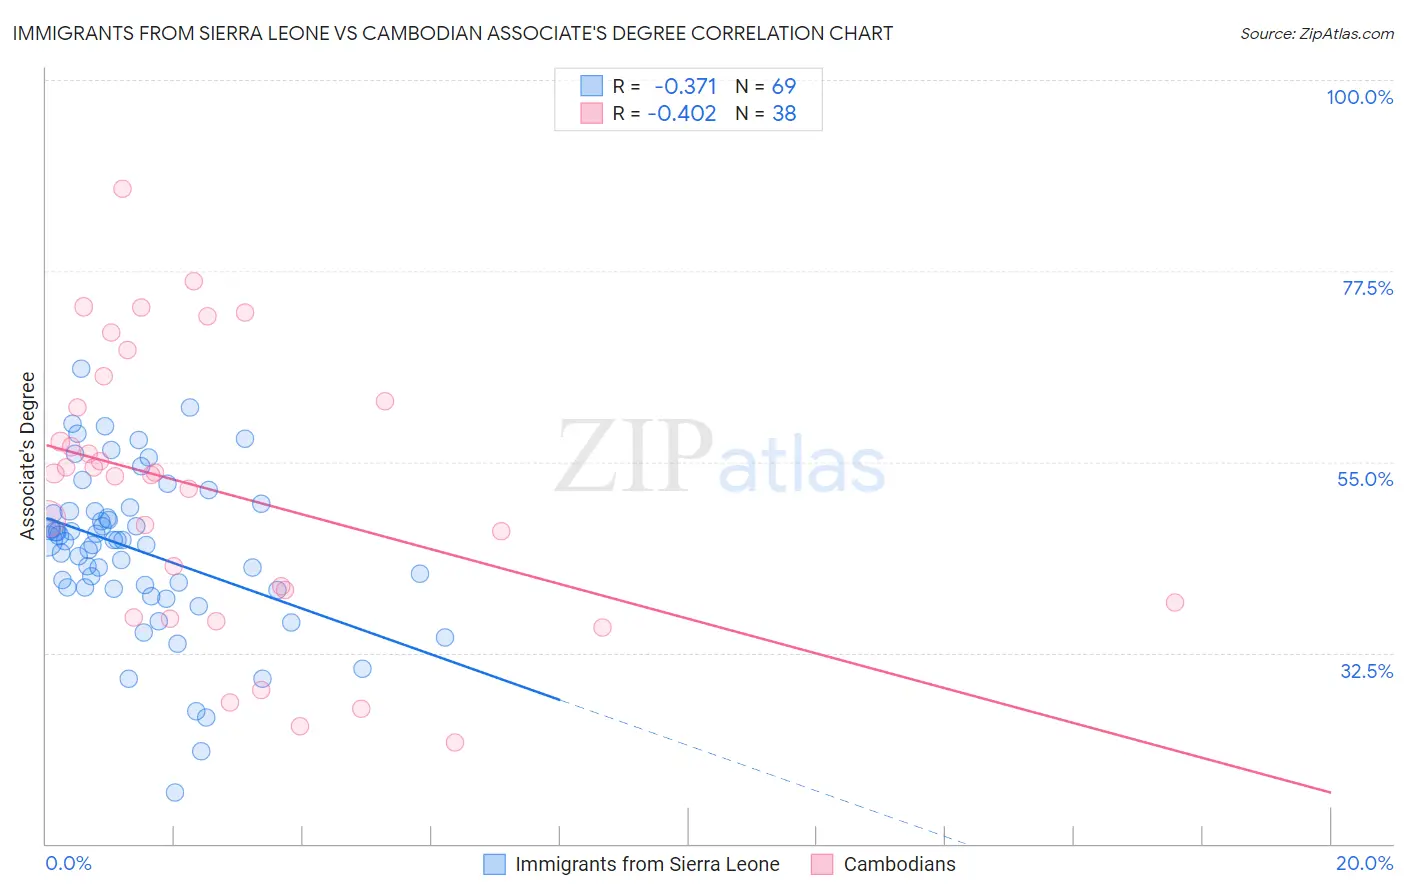
Immigrants from Sierra Leone vs Cambodian Associate's Degree Correlation Chart
The statistical analysis conducted on geographies consisting of 101,624,736 people shows a mild negative correlation between the proportion of Immigrants from Sierra Leone and percentage of population with at least associate's degree education in the United States with a correlation coefficient (R) of -0.371 and weighted average of 46.7%. Similarly, the statistical analysis conducted on geographies consisting of 102,512,775 people shows a moderate negative correlation between the proportion of Cambodians and percentage of population with at least associate's degree education in the United States with a correlation coefficient (R) of -0.402 and weighted average of 54.6%, a difference of 17.1%.
Associate's Degree Correlation Summary
| Measurement | Immigrants from Sierra Leone | Cambodian |
| Minimum | 16.1% | 21.9% |
| Maximum | 66.0% | 87.2% |
| Range | 50.0% | 65.4% |
| Mean | 44.5% | 51.5% |
| Median | 45.7% | 53.5% |
| Interquartile 25% (IQ1) | 40.1% | 38.4% |
| Interquartile 75% (IQ3) | 49.2% | 62.1% |
| Interquartile Range (IQR) | 9.1% | 23.7% |
| Standard Deviation (Sample) | 9.5% | 16.3% |
| Standard Deviation (Population) | 9.4% | 16.1% |
Similar Demographics by Associate's Degree
Demographics Similar to Immigrants from Sierra Leone by Associate's Degree
In terms of associate's degree, the demographic groups most similar to Immigrants from Sierra Leone are Hungarian (46.7%, a difference of 0.010%), Immigrants from South America (46.7%, a difference of 0.050%), Colombian (46.8%, a difference of 0.25%), Somali (46.8%, a difference of 0.26%), and Immigrants from Somalia (46.5%, a difference of 0.29%).
| Demographics | Rating | Rank | Associate's Degree |
| Scottish | 65.4 /100 | #160 | Good 46.9% |
| Scandinavians | 65.2 /100 | #161 | Good 46.9% |
| Immigrants | Africa | 63.2 /100 | #162 | Good 46.8% |
| Somalis | 62.5 /100 | #163 | Good 46.8% |
| Colombians | 62.4 /100 | #164 | Good 46.8% |
| Immigrants | South America | 59.9 /100 | #165 | Average 46.7% |
| Hungarians | 59.3 /100 | #166 | Average 46.7% |
| Immigrants | Sierra Leone | 59.2 /100 | #167 | Average 46.7% |
| Immigrants | Somalia | 55.5 /100 | #168 | Average 46.5% |
| Uruguayans | 55.4 /100 | #169 | Average 46.5% |
| Irish | 53.6 /100 | #170 | Average 46.5% |
| Basques | 52.8 /100 | #171 | Average 46.5% |
| Peruvians | 50.5 /100 | #172 | Average 46.4% |
| Immigrants | Iraq | 50.3 /100 | #173 | Average 46.4% |
| English | 50.0 /100 | #174 | Average 46.4% |
Demographics Similar to Cambodians by Associate's Degree
In terms of associate's degree, the demographic groups most similar to Cambodians are Immigrants from Ireland (54.7%, a difference of 0.020%), Immigrants from Sweden (54.6%, a difference of 0.060%), Immigrants from Japan (54.6%, a difference of 0.10%), Burmese (54.6%, a difference of 0.10%), and Immigrants from Korea (54.5%, a difference of 0.19%).
| Demographics | Rating | Rank | Associate's Degree |
| Immigrants | China | 100.0 /100 | #13 | Exceptional 55.5% |
| Immigrants | Hong Kong | 100.0 /100 | #14 | Exceptional 55.4% |
| Immigrants | Eastern Asia | 100.0 /100 | #15 | Exceptional 55.4% |
| Soviet Union | 100.0 /100 | #16 | Exceptional 55.1% |
| Eastern Europeans | 100.0 /100 | #17 | Exceptional 55.0% |
| Indians (Asian) | 100.0 /100 | #18 | Exceptional 54.8% |
| Immigrants | Ireland | 100.0 /100 | #19 | Exceptional 54.7% |
| Cambodians | 100.0 /100 | #20 | Exceptional 54.6% |
| Immigrants | Sweden | 100.0 /100 | #21 | Exceptional 54.6% |
| Immigrants | Japan | 100.0 /100 | #22 | Exceptional 54.6% |
| Burmese | 100.0 /100 | #23 | Exceptional 54.6% |
| Immigrants | Korea | 100.0 /100 | #24 | Exceptional 54.5% |
| Immigrants | Switzerland | 100.0 /100 | #25 | Exceptional 54.5% |
| Immigrants | Belgium | 100.0 /100 | #26 | Exceptional 54.5% |
| Latvians | 100.0 /100 | #27 | Exceptional 53.9% |