Immigrants from Sierra Leone vs Belgian Associate's Degree
COMPARE
Immigrants from Sierra Leone
Belgian
Associate's Degree
Associate's Degree Comparison
Immigrants from Sierra Leone
Belgians
46.7%
ASSOCIATE'S DEGREE
59.2/ 100
METRIC RATING
167th/ 347
METRIC RANK
46.3%
ASSOCIATE'S DEGREE
48.9/ 100
METRIC RATING
175th/ 347
METRIC RANK
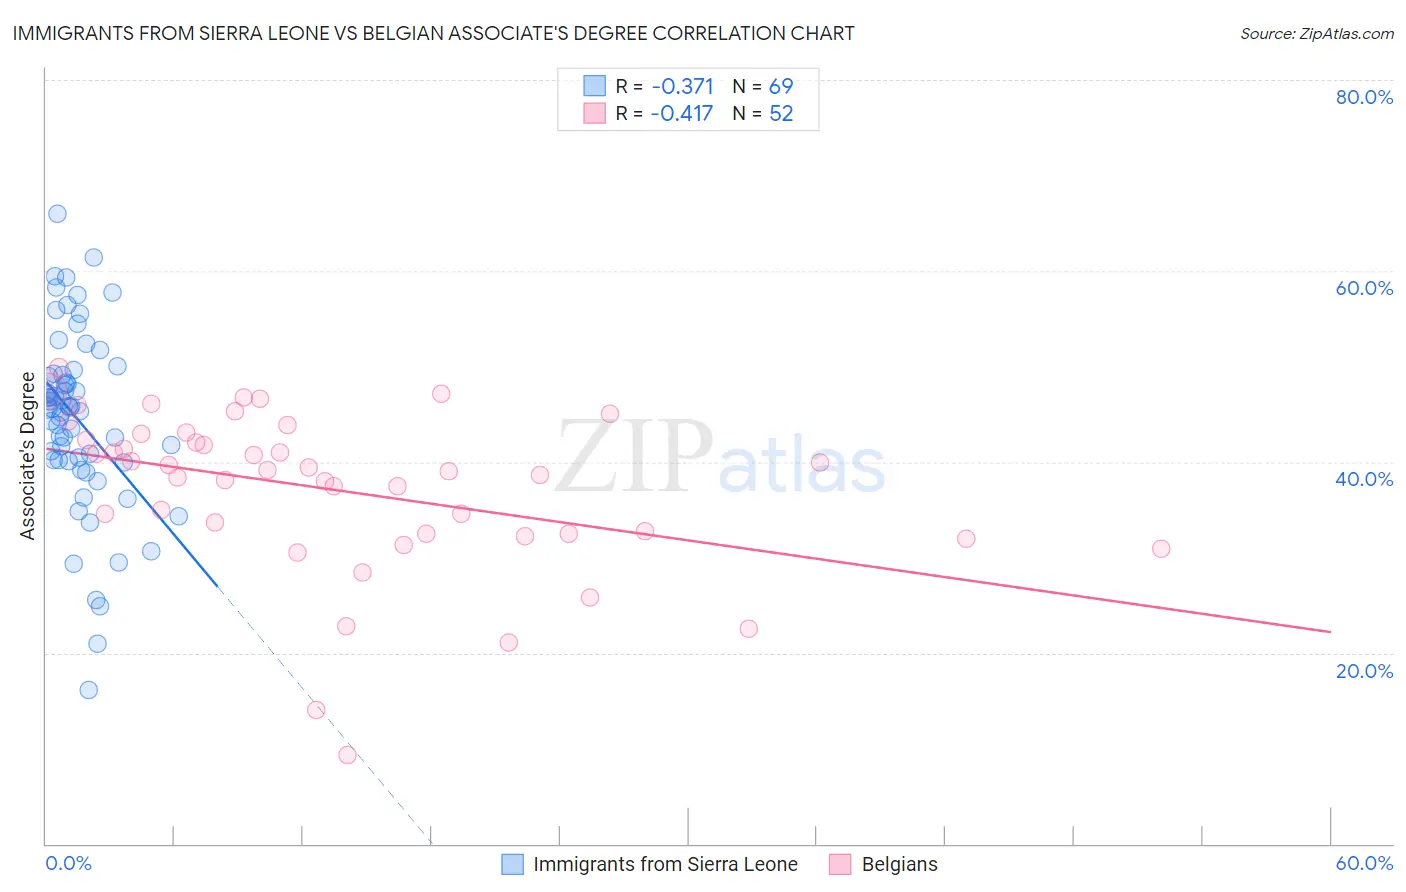
Immigrants from Sierra Leone vs Belgian Associate's Degree Correlation Chart
The statistical analysis conducted on geographies consisting of 101,624,736 people shows a mild negative correlation between the proportion of Immigrants from Sierra Leone and percentage of population with at least associate's degree education in the United States with a correlation coefficient (R) of -0.371 and weighted average of 46.7%. Similarly, the statistical analysis conducted on geographies consisting of 356,008,958 people shows a moderate negative correlation between the proportion of Belgians and percentage of population with at least associate's degree education in the United States with a correlation coefficient (R) of -0.417 and weighted average of 46.3%, a difference of 0.78%.
Associate's Degree Correlation Summary
| Measurement | Immigrants from Sierra Leone | Belgian |
| Minimum | 16.1% | 9.3% |
| Maximum | 66.0% | 49.9% |
| Range | 50.0% | 40.6% |
| Mean | 44.5% | 37.0% |
| Median | 45.7% | 39.0% |
| Interquartile 25% (IQ1) | 40.1% | 32.5% |
| Interquartile 75% (IQ3) | 49.2% | 42.6% |
| Interquartile Range (IQR) | 9.1% | 10.2% |
| Standard Deviation (Sample) | 9.5% | 8.5% |
| Standard Deviation (Population) | 9.4% | 8.4% |
Demographics Similar to Immigrants from Sierra Leone and Belgians by Associate's Degree
In terms of associate's degree, the demographic groups most similar to Immigrants from Sierra Leone are Hungarian (46.7%, a difference of 0.010%), Immigrants from South America (46.7%, a difference of 0.050%), Colombian (46.8%, a difference of 0.25%), Somali (46.8%, a difference of 0.26%), and Immigrants from Somalia (46.5%, a difference of 0.29%). Similarly, the demographic groups most similar to Belgians are Finnish (46.3%, a difference of 0.020%), Slovak (46.3%, a difference of 0.040%), Immigrants from Bosnia and Herzegovina (46.3%, a difference of 0.040%), English (46.4%, a difference of 0.090%), and Immigrants from Iraq (46.4%, a difference of 0.10%).
| Demographics | Rating | Rank | Associate's Degree |
| Scandinavians | 65.2 /100 | #161 | Good 46.9% |
| Immigrants | Africa | 63.2 /100 | #162 | Good 46.8% |
| Somalis | 62.5 /100 | #163 | Good 46.8% |
| Colombians | 62.4 /100 | #164 | Good 46.8% |
| Immigrants | South America | 59.9 /100 | #165 | Average 46.7% |
| Hungarians | 59.3 /100 | #166 | Average 46.7% |
| Immigrants | Sierra Leone | 59.2 /100 | #167 | Average 46.7% |
| Immigrants | Somalia | 55.5 /100 | #168 | Average 46.5% |
| Uruguayans | 55.4 /100 | #169 | Average 46.5% |
| Irish | 53.6 /100 | #170 | Average 46.5% |
| Basques | 52.8 /100 | #171 | Average 46.5% |
| Peruvians | 50.5 /100 | #172 | Average 46.4% |
| Immigrants | Iraq | 50.3 /100 | #173 | Average 46.4% |
| English | 50.0 /100 | #174 | Average 46.4% |
| Belgians | 48.9 /100 | #175 | Average 46.3% |
| Finns | 48.5 /100 | #176 | Average 46.3% |
| Slovaks | 48.4 /100 | #177 | Average 46.3% |
| Immigrants | Bosnia and Herzegovina | 48.3 /100 | #178 | Average 46.3% |
| Sri Lankans | 47.6 /100 | #179 | Average 46.3% |
| Bermudans | 46.4 /100 | #180 | Average 46.2% |
| Immigrants | Colombia | 41.3 /100 | #181 | Average 46.0% |