Immigrants from Senegal vs Immigrants from Southern Europe College, Under 1 year
COMPARE
Immigrants from Senegal
Immigrants from Southern Europe
College, Under 1 year
College, Under 1 year Comparison
Immigrants from Senegal
Immigrants from Southern Europe
63.3%
COLLEGE, UNDER 1 YEAR
5.0/ 100
METRIC RATING
222nd/ 347
METRIC RANK
64.9%
COLLEGE, UNDER 1 YEAR
34.3/ 100
METRIC RATING
187th/ 347
METRIC RANK
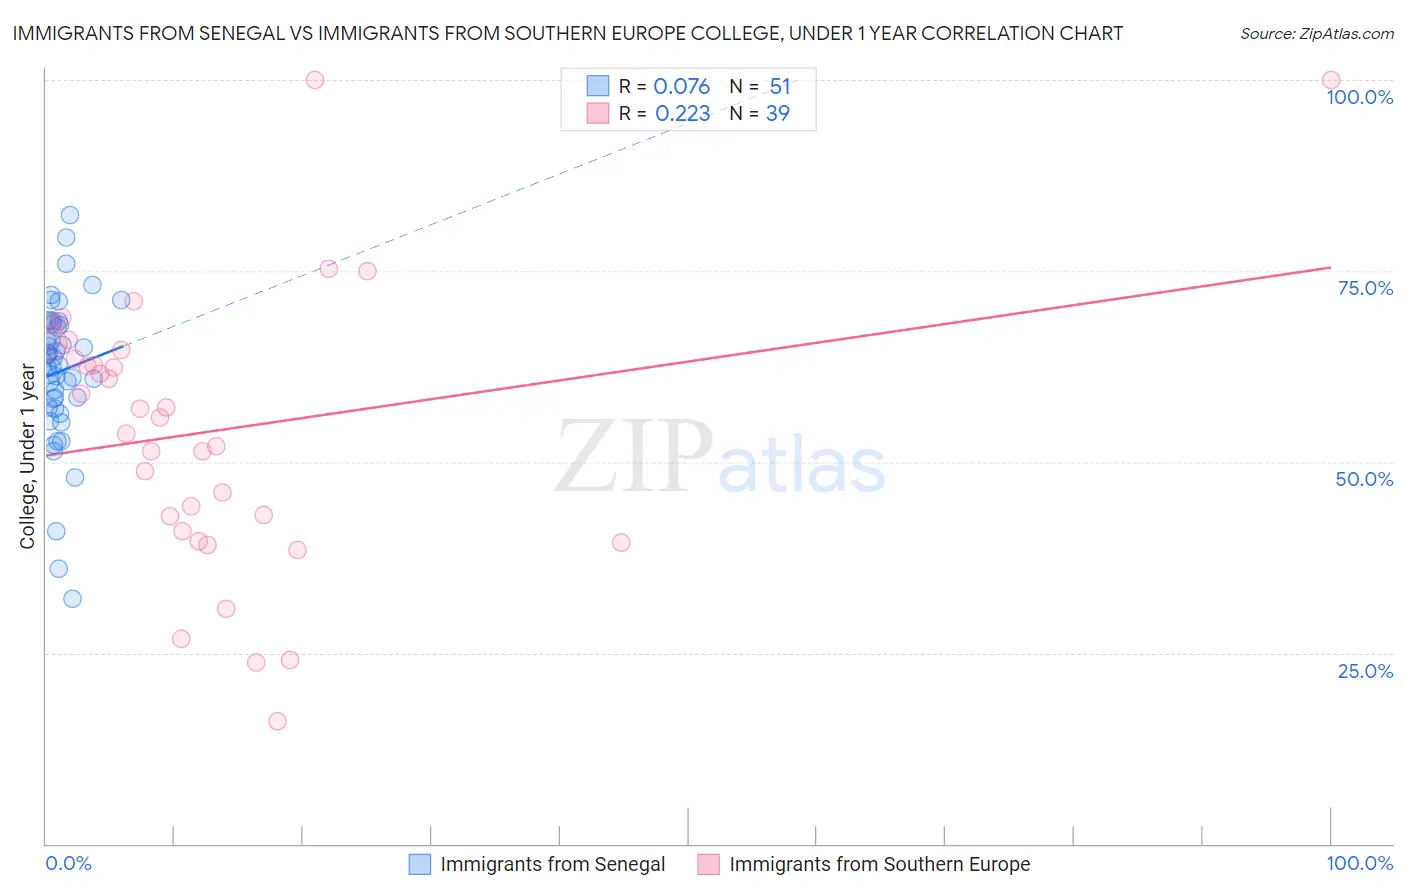
Immigrants from Senegal vs Immigrants from Southern Europe College, Under 1 year Correlation Chart
The statistical analysis conducted on geographies consisting of 90,129,295 people shows a slight positive correlation between the proportion of Immigrants from Senegal and percentage of population with at least college, under 1 year education in the United States with a correlation coefficient (R) of 0.076 and weighted average of 63.3%. Similarly, the statistical analysis conducted on geographies consisting of 402,801,573 people shows a weak positive correlation between the proportion of Immigrants from Southern Europe and percentage of population with at least college, under 1 year education in the United States with a correlation coefficient (R) of 0.223 and weighted average of 64.9%, a difference of 2.6%.
College, Under 1 year Correlation Summary
| Measurement | Immigrants from Senegal | Immigrants from Southern Europe |
| Minimum | 32.1% | 16.1% |
| Maximum | 82.4% | 100.0% |
| Range | 50.2% | 83.9% |
| Mean | 61.9% | 54.1% |
| Median | 62.6% | 55.8% |
| Interquartile 25% (IQ1) | 57.1% | 40.9% |
| Interquartile 75% (IQ3) | 68.1% | 64.6% |
| Interquartile Range (IQR) | 11.0% | 23.6% |
| Standard Deviation (Sample) | 9.5% | 18.3% |
| Standard Deviation (Population) | 9.4% | 18.1% |
Similar Demographics by College, Under 1 year
Demographics Similar to Immigrants from Senegal by College, Under 1 year
In terms of college, under 1 year, the demographic groups most similar to Immigrants from Senegal are Cree (63.3%, a difference of 0.050%), Immigrants from Costa Rica (63.2%, a difference of 0.12%), Portuguese (63.4%, a difference of 0.14%), Subsaharan African (63.2%, a difference of 0.15%), and Immigrants from Panama (63.4%, a difference of 0.16%).
| Demographics | Rating | Rank | College, Under 1 year |
| Senegalese | 7.7 /100 | #215 | Tragic 63.6% |
| Hmong | 6.8 /100 | #216 | Tragic 63.5% |
| Immigrants | Uruguay | 5.8 /100 | #217 | Tragic 63.4% |
| Immigrants | Panama | 5.7 /100 | #218 | Tragic 63.4% |
| Immigrants | Fiji | 5.7 /100 | #219 | Tragic 63.4% |
| Portuguese | 5.6 /100 | #220 | Tragic 63.4% |
| Cree | 5.2 /100 | #221 | Tragic 63.3% |
| Immigrants | Senegal | 5.0 /100 | #222 | Tragic 63.3% |
| Immigrants | Costa Rica | 4.5 /100 | #223 | Tragic 63.2% |
| Sub-Saharan Africans | 4.4 /100 | #224 | Tragic 63.2% |
| Immigrants | Peru | 4.0 /100 | #225 | Tragic 63.1% |
| Immigrants | Colombia | 4.0 /100 | #226 | Tragic 63.1% |
| Immigrants | Ghana | 3.7 /100 | #227 | Tragic 63.1% |
| Samoans | 3.3 /100 | #228 | Tragic 63.0% |
| Liberians | 3.2 /100 | #229 | Tragic 63.0% |
Demographics Similar to Immigrants from Southern Europe by College, Under 1 year
In terms of college, under 1 year, the demographic groups most similar to Immigrants from Southern Europe are Immigrants from Albania (64.9%, a difference of 0.11%), Spanish (64.9%, a difference of 0.14%), Immigrants from Philippines (64.8%, a difference of 0.21%), Immigrants from Sierra Leone (65.1%, a difference of 0.26%), and Immigrants from Armenia (64.7%, a difference of 0.32%).
| Demographics | Rating | Rank | College, Under 1 year |
| Dutch | 46.1 /100 | #180 | Average 65.3% |
| Spaniards | 45.5 /100 | #181 | Average 65.3% |
| Immigrants | Africa | 44.7 /100 | #182 | Average 65.3% |
| Immigrants | Poland | 42.6 /100 | #183 | Average 65.2% |
| Bermudans | 42.0 /100 | #184 | Average 65.2% |
| Sri Lankans | 41.7 /100 | #185 | Average 65.2% |
| Immigrants | Sierra Leone | 39.7 /100 | #186 | Fair 65.1% |
| Immigrants | Southern Europe | 34.3 /100 | #187 | Fair 64.9% |
| Immigrants | Albania | 32.0 /100 | #188 | Fair 64.9% |
| Spanish | 31.6 /100 | #189 | Fair 64.9% |
| Immigrants | Philippines | 30.1 /100 | #190 | Fair 64.8% |
| Immigrants | Armenia | 28.1 /100 | #191 | Fair 64.7% |
| Immigrants | Thailand | 27.0 /100 | #192 | Fair 64.7% |
| Slovaks | 26.7 /100 | #193 | Fair 64.7% |
| Immigrants | Cameroon | 24.6 /100 | #194 | Fair 64.6% |