Immigrants from Sri Lanka vs Immigrants from England College, 1 year or more
COMPARE
Immigrants from Sri Lanka
Immigrants from England
College, 1 year or more
College, 1 year or more Comparison
Immigrants from Sri Lanka
Immigrants from England
65.4%
COLLEGE, 1 YEAR OR MORE
99.9/ 100
METRIC RATING
33rd/ 347
METRIC RANK
62.8%
COLLEGE, 1 YEAR OR MORE
98.6/ 100
METRIC RATING
84th/ 347
METRIC RANK
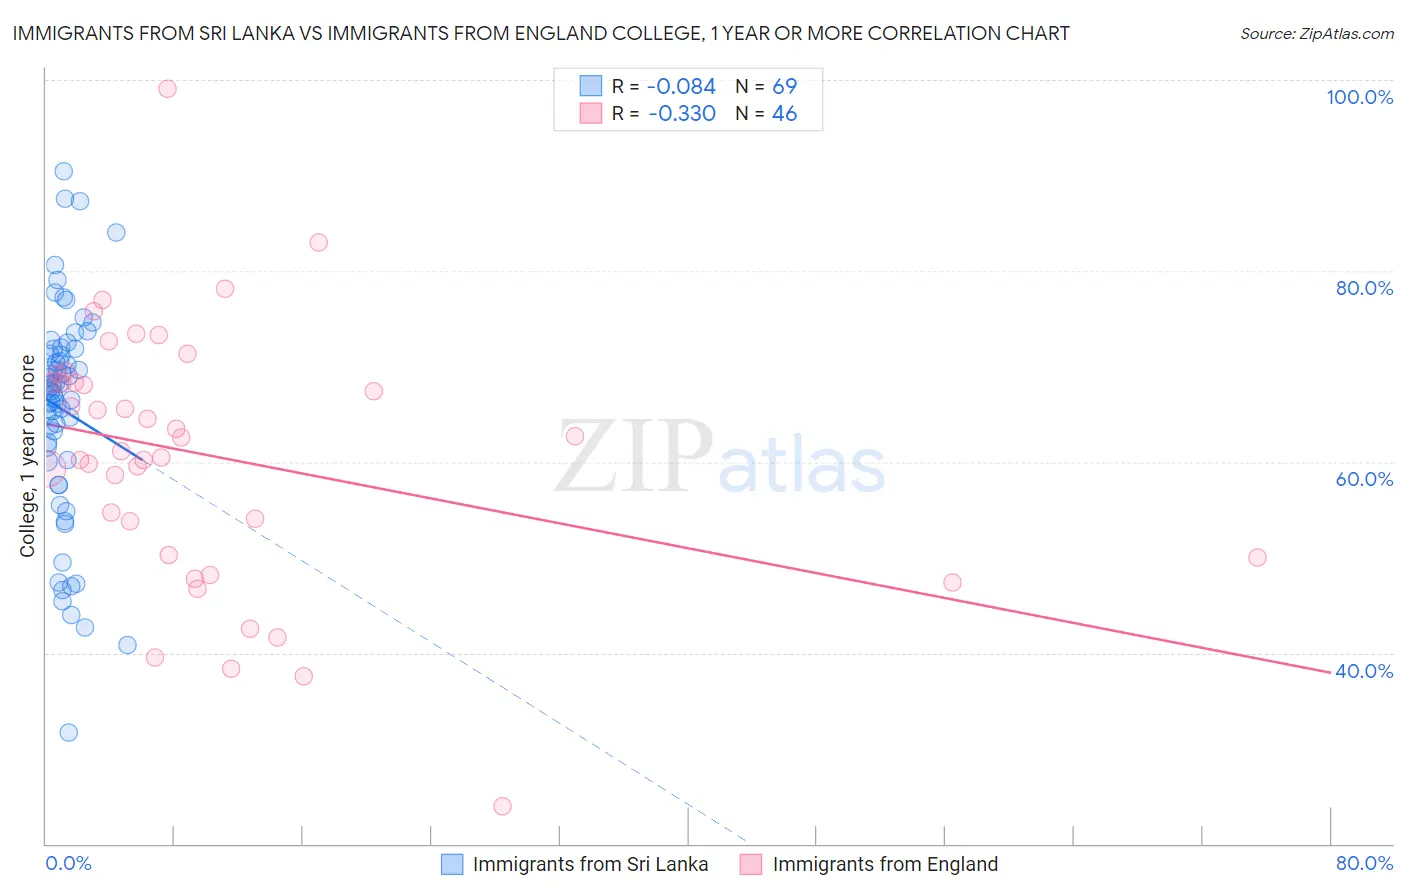
Immigrants from Sri Lanka vs Immigrants from England College, 1 year or more Correlation Chart
The statistical analysis conducted on geographies consisting of 149,700,552 people shows a slight negative correlation between the proportion of Immigrants from Sri Lanka and percentage of population with at least college, 1 year or more education in the United States with a correlation coefficient (R) of -0.084 and weighted average of 65.4%. Similarly, the statistical analysis conducted on geographies consisting of 391,895,815 people shows a mild negative correlation between the proportion of Immigrants from England and percentage of population with at least college, 1 year or more education in the United States with a correlation coefficient (R) of -0.330 and weighted average of 62.8%, a difference of 4.2%.
College, 1 year or more Correlation Summary
| Measurement | Immigrants from Sri Lanka | Immigrants from England |
| Minimum | 31.7% | 23.9% |
| Maximum | 90.4% | 99.1% |
| Range | 58.7% | 75.3% |
| Mean | 65.4% | 60.6% |
| Median | 67.7% | 61.9% |
| Interquartile 25% (IQ1) | 60.1% | 50.3% |
| Interquartile 75% (IQ3) | 71.9% | 68.4% |
| Interquartile Range (IQR) | 11.8% | 18.1% |
| Standard Deviation (Sample) | 11.5% | 13.7% |
| Standard Deviation (Population) | 11.4% | 13.6% |
Similar Demographics by College, 1 year or more
Demographics Similar to Immigrants from Sri Lanka by College, 1 year or more
In terms of college, 1 year or more, the demographic groups most similar to Immigrants from Sri Lanka are Israeli (65.3%, a difference of 0.12%), Bulgarian (65.5%, a difference of 0.15%), Turkish (65.5%, a difference of 0.20%), Immigrants from Denmark (65.6%, a difference of 0.28%), and Immigrants from Turkey (65.2%, a difference of 0.32%).
| Demographics | Rating | Rank | College, 1 year or more |
| Latvians | 100.0 /100 | #26 | Exceptional 66.1% |
| Immigrants | Ireland | 100.0 /100 | #27 | Exceptional 65.9% |
| Immigrants | France | 100.0 /100 | #28 | Exceptional 65.8% |
| Immigrants | Northern Europe | 100.0 /100 | #29 | Exceptional 65.6% |
| Immigrants | Denmark | 100.0 /100 | #30 | Exceptional 65.6% |
| Turks | 100.0 /100 | #31 | Exceptional 65.5% |
| Bulgarians | 100.0 /100 | #32 | Exceptional 65.5% |
| Immigrants | Sri Lanka | 99.9 /100 | #33 | Exceptional 65.4% |
| Israelis | 99.9 /100 | #34 | Exceptional 65.3% |
| Immigrants | Turkey | 99.9 /100 | #35 | Exceptional 65.2% |
| Immigrants | South Africa | 99.9 /100 | #36 | Exceptional 65.1% |
| Russians | 99.9 /100 | #37 | Exceptional 65.1% |
| Immigrants | Saudi Arabia | 99.9 /100 | #38 | Exceptional 65.0% |
| Estonians | 99.9 /100 | #39 | Exceptional 65.0% |
| Immigrants | Kuwait | 99.9 /100 | #40 | Exceptional 65.0% |
Demographics Similar to Immigrants from England by College, 1 year or more
In terms of college, 1 year or more, the demographic groups most similar to Immigrants from England are Immigrants from Pakistan (62.8%, a difference of 0.010%), Immigrants from Argentina (62.8%, a difference of 0.030%), Immigrants from Western Europe (62.7%, a difference of 0.030%), Immigrants from Hungary (62.7%, a difference of 0.040%), and Immigrants from Bolivia (62.8%, a difference of 0.070%).
| Demographics | Rating | Rank | College, 1 year or more |
| Ethiopians | 98.8 /100 | #77 | Exceptional 62.9% |
| Immigrants | Lebanon | 98.8 /100 | #78 | Exceptional 62.9% |
| Northern Europeans | 98.8 /100 | #79 | Exceptional 62.9% |
| Lithuanians | 98.8 /100 | #80 | Exceptional 62.9% |
| Laotians | 98.7 /100 | #81 | Exceptional 62.8% |
| Immigrants | Bolivia | 98.7 /100 | #82 | Exceptional 62.8% |
| Immigrants | Argentina | 98.6 /100 | #83 | Exceptional 62.8% |
| Immigrants | England | 98.6 /100 | #84 | Exceptional 62.8% |
| Immigrants | Pakistan | 98.6 /100 | #85 | Exceptional 62.8% |
| Immigrants | Western Europe | 98.6 /100 | #86 | Exceptional 62.7% |
| Immigrants | Hungary | 98.6 /100 | #87 | Exceptional 62.7% |
| Greeks | 98.3 /100 | #88 | Exceptional 62.6% |
| Immigrants | Ethiopia | 98.2 /100 | #89 | Exceptional 62.6% |
| Immigrants | Western Asia | 97.9 /100 | #90 | Exceptional 62.5% |
| Immigrants | Eastern Europe | 97.8 /100 | #91 | Exceptional 62.4% |