Immigrants from Philippines vs Immigrants from England College, 1 year or more
COMPARE
Immigrants from Philippines
Immigrants from England
College, 1 year or more
College, 1 year or more Comparison
Immigrants from Philippines
Immigrants from England
58.7%
COLLEGE, 1 YEAR OR MORE
29.2/ 100
METRIC RATING
191st/ 347
METRIC RANK
62.8%
COLLEGE, 1 YEAR OR MORE
98.6/ 100
METRIC RATING
84th/ 347
METRIC RANK
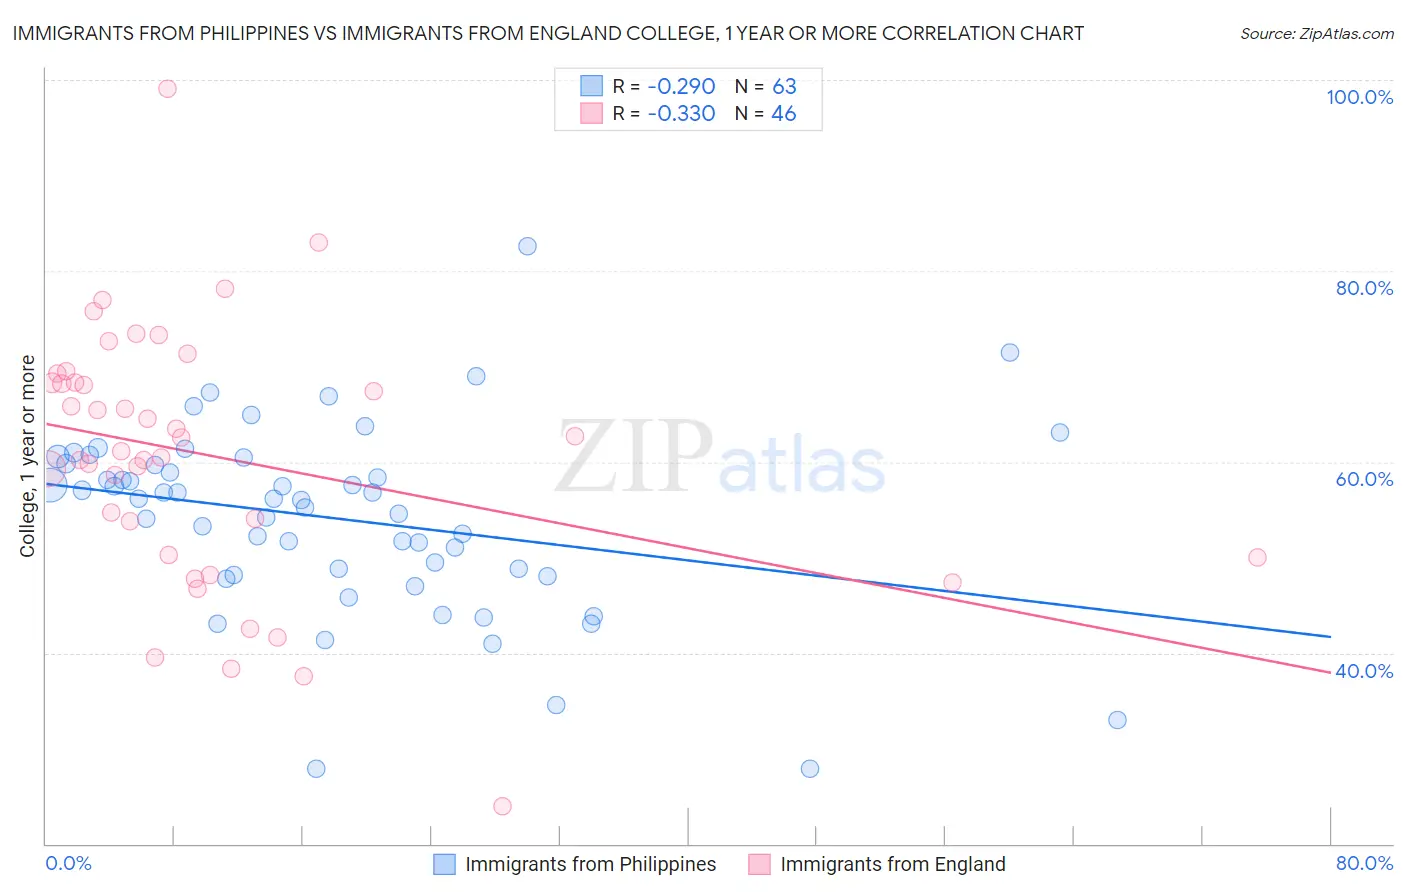
Immigrants from Philippines vs Immigrants from England College, 1 year or more Correlation Chart
The statistical analysis conducted on geographies consisting of 471,303,821 people shows a weak negative correlation between the proportion of Immigrants from Philippines and percentage of population with at least college, 1 year or more education in the United States with a correlation coefficient (R) of -0.290 and weighted average of 58.7%. Similarly, the statistical analysis conducted on geographies consisting of 391,895,815 people shows a mild negative correlation between the proportion of Immigrants from England and percentage of population with at least college, 1 year or more education in the United States with a correlation coefficient (R) of -0.330 and weighted average of 62.8%, a difference of 6.9%.
College, 1 year or more Correlation Summary
| Measurement | Immigrants from Philippines | Immigrants from England |
| Minimum | 27.9% | 23.9% |
| Maximum | 82.6% | 99.1% |
| Range | 54.7% | 75.3% |
| Mean | 54.1% | 60.6% |
| Median | 56.1% | 61.9% |
| Interquartile 25% (IQ1) | 48.1% | 50.3% |
| Interquartile 75% (IQ3) | 59.9% | 68.4% |
| Interquartile Range (IQR) | 11.7% | 18.1% |
| Standard Deviation (Sample) | 9.9% | 13.7% |
| Standard Deviation (Population) | 9.8% | 13.6% |
Similar Demographics by College, 1 year or more
Demographics Similar to Immigrants from Philippines by College, 1 year or more
In terms of college, 1 year or more, the demographic groups most similar to Immigrants from Philippines are Colombian (58.7%, a difference of 0.10%), Peruvian (58.6%, a difference of 0.11%), Immigrants from Cameroon (58.8%, a difference of 0.13%), Uruguayan (58.8%, a difference of 0.17%), and Costa Rican (58.6%, a difference of 0.18%).
| Demographics | Rating | Rank | College, 1 year or more |
| Spaniards | 38.3 /100 | #184 | Fair 59.0% |
| South Americans | 35.9 /100 | #185 | Fair 59.0% |
| Scotch-Irish | 34.7 /100 | #186 | Fair 58.9% |
| Germans | 34.7 /100 | #187 | Fair 58.9% |
| French | 34.4 /100 | #188 | Fair 58.9% |
| Uruguayans | 31.8 /100 | #189 | Fair 58.8% |
| Immigrants | Cameroon | 31.2 /100 | #190 | Fair 58.8% |
| Immigrants | Philippines | 29.2 /100 | #191 | Fair 58.7% |
| Colombians | 27.6 /100 | #192 | Fair 58.7% |
| Peruvians | 27.5 /100 | #193 | Fair 58.6% |
| Costa Ricans | 26.4 /100 | #194 | Fair 58.6% |
| Dutch | 26.2 /100 | #195 | Fair 58.6% |
| Guamanians/Chamorros | 26.2 /100 | #196 | Fair 58.6% |
| Immigrants | Thailand | 26.0 /100 | #197 | Fair 58.6% |
| Immigrants | South Eastern Asia | 25.1 /100 | #198 | Fair 58.5% |
Demographics Similar to Immigrants from England by College, 1 year or more
In terms of college, 1 year or more, the demographic groups most similar to Immigrants from England are Immigrants from Pakistan (62.8%, a difference of 0.010%), Immigrants from Argentina (62.8%, a difference of 0.030%), Immigrants from Western Europe (62.7%, a difference of 0.030%), Immigrants from Hungary (62.7%, a difference of 0.040%), and Immigrants from Bolivia (62.8%, a difference of 0.070%).
| Demographics | Rating | Rank | College, 1 year or more |
| Ethiopians | 98.8 /100 | #77 | Exceptional 62.9% |
| Immigrants | Lebanon | 98.8 /100 | #78 | Exceptional 62.9% |
| Northern Europeans | 98.8 /100 | #79 | Exceptional 62.9% |
| Lithuanians | 98.8 /100 | #80 | Exceptional 62.9% |
| Laotians | 98.7 /100 | #81 | Exceptional 62.8% |
| Immigrants | Bolivia | 98.7 /100 | #82 | Exceptional 62.8% |
| Immigrants | Argentina | 98.6 /100 | #83 | Exceptional 62.8% |
| Immigrants | England | 98.6 /100 | #84 | Exceptional 62.8% |
| Immigrants | Pakistan | 98.6 /100 | #85 | Exceptional 62.8% |
| Immigrants | Western Europe | 98.6 /100 | #86 | Exceptional 62.7% |
| Immigrants | Hungary | 98.6 /100 | #87 | Exceptional 62.7% |
| Greeks | 98.3 /100 | #88 | Exceptional 62.6% |
| Immigrants | Ethiopia | 98.2 /100 | #89 | Exceptional 62.6% |
| Immigrants | Western Asia | 97.9 /100 | #90 | Exceptional 62.5% |
| Immigrants | Eastern Europe | 97.8 /100 | #91 | Exceptional 62.4% |