Immigrants from Portugal vs Cheyenne Unemployment Among Seniors over 65 years
COMPARE
Immigrants from Portugal
Cheyenne
Unemployment Among Seniors over 65 years
Unemployment Among Seniors over 65 years Comparison
Immigrants from Portugal
Cheyenne
6.0%
UNEMPLOYMENT AMONG SENIORS OVER 65 YEARS
0.0/ 100
METRIC RATING
330th/ 347
METRIC RANK
5.5%
UNEMPLOYMENT AMONG SENIORS OVER 65 YEARS
0.0/ 100
METRIC RATING
295th/ 347
METRIC RANK
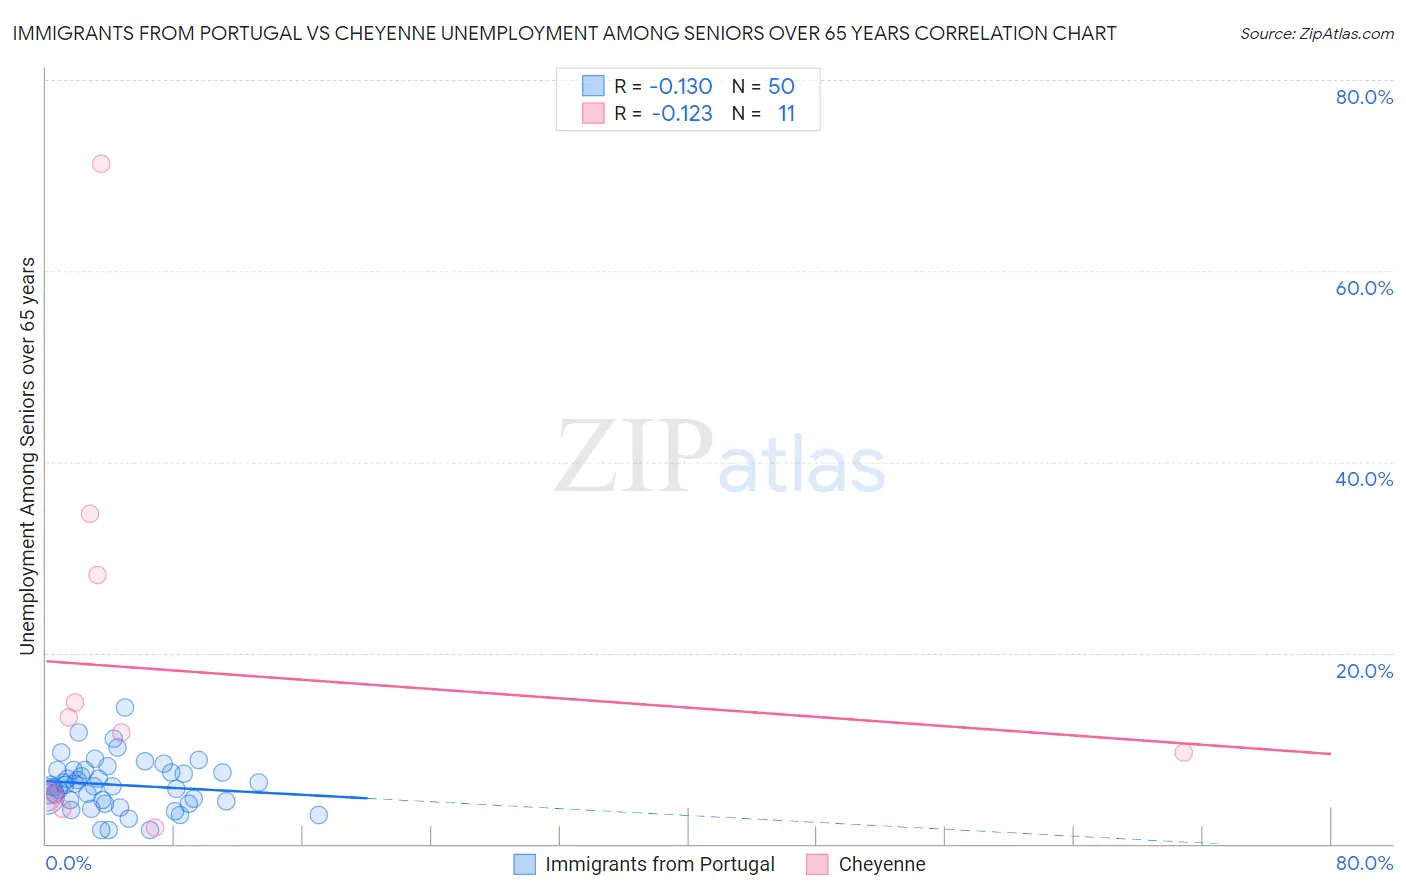
Immigrants from Portugal vs Cheyenne Unemployment Among Seniors over 65 years Correlation Chart
The statistical analysis conducted on geographies consisting of 166,846,438 people shows a poor negative correlation between the proportion of Immigrants from Portugal and unemployment rate amomg seniors over the age of 65 in the United States with a correlation coefficient (R) of -0.130 and weighted average of 6.0%. Similarly, the statistical analysis conducted on geographies consisting of 76,688,001 people shows a poor negative correlation between the proportion of Cheyenne and unemployment rate amomg seniors over the age of 65 in the United States with a correlation coefficient (R) of -0.123 and weighted average of 5.5%, a difference of 7.5%.
Unemployment Among Seniors over 65 years Correlation Summary
| Measurement | Immigrants from Portugal | Cheyenne |
| Minimum | 1.4% | 1.7% |
| Maximum | 14.3% | 71.2% |
| Range | 12.9% | 69.5% |
| Mean | 6.2% | 18.1% |
| Median | 6.1% | 11.7% |
| Interquartile 25% (IQ1) | 4.5% | 4.9% |
| Interquartile 75% (IQ3) | 7.7% | 28.2% |
| Interquartile Range (IQR) | 3.2% | 23.3% |
| Standard Deviation (Sample) | 2.6% | 20.4% |
| Standard Deviation (Population) | 2.6% | 19.5% |
Similar Demographics by Unemployment Among Seniors over 65 years
Demographics Similar to Immigrants from Portugal by Unemployment Among Seniors over 65 years
In terms of unemployment among seniors over 65 years, the demographic groups most similar to Immigrants from Portugal are Dominican (6.0%, a difference of 0.020%), Taiwanese (6.0%, a difference of 0.15%), Aleut (6.0%, a difference of 0.20%), Immigrants from Dominican Republic (6.0%, a difference of 0.75%), and Puerto Rican (5.9%, a difference of 0.77%).
| Demographics | Rating | Rank | Unemployment Among Seniors over 65 years |
| Immigrants | Dominica | 0.0 /100 | #323 | Tragic 5.8% |
| Yuman | 0.0 /100 | #324 | Tragic 5.8% |
| Inupiat | 0.0 /100 | #325 | Tragic 5.8% |
| Shoshone | 0.0 /100 | #326 | Tragic 5.9% |
| Bermudans | 0.0 /100 | #327 | Tragic 5.9% |
| Puerto Ricans | 0.0 /100 | #328 | Tragic 5.9% |
| Dominicans | 0.0 /100 | #329 | Tragic 6.0% |
| Immigrants | Portugal | 0.0 /100 | #330 | Tragic 6.0% |
| Taiwanese | 0.0 /100 | #331 | Tragic 6.0% |
| Aleuts | 0.0 /100 | #332 | Tragic 6.0% |
| Immigrants | Dominican Republic | 0.0 /100 | #333 | Tragic 6.0% |
| Tohono O'odham | 0.0 /100 | #334 | Tragic 6.1% |
| Immigrants | Armenia | 0.0 /100 | #335 | Tragic 6.2% |
| Pima | 0.0 /100 | #336 | Tragic 6.3% |
| Alaska Natives | 0.0 /100 | #337 | Tragic 6.3% |
Demographics Similar to Cheyenne by Unemployment Among Seniors over 65 years
In terms of unemployment among seniors over 65 years, the demographic groups most similar to Cheyenne are Cape Verdean (5.5%, a difference of 0.010%), Yaqui (5.5%, a difference of 0.020%), Armenian (5.5%, a difference of 0.070%), Immigrants from Venezuela (5.5%, a difference of 0.11%), and Immigrants from West Indies (5.6%, a difference of 0.14%).
| Demographics | Rating | Rank | Unemployment Among Seniors over 65 years |
| U.S. Virgin Islanders | 0.0 /100 | #288 | Tragic 5.5% |
| Immigrants | Cabo Verde | 0.0 /100 | #289 | Tragic 5.5% |
| Jamaicans | 0.0 /100 | #290 | Tragic 5.5% |
| Blacks/African Americans | 0.0 /100 | #291 | Tragic 5.5% |
| Belizeans | 0.0 /100 | #292 | Tragic 5.5% |
| Immigrants | Venezuela | 0.0 /100 | #293 | Tragic 5.5% |
| Armenians | 0.0 /100 | #294 | Tragic 5.5% |
| Cheyenne | 0.0 /100 | #295 | Tragic 5.5% |
| Cape Verdeans | 0.0 /100 | #296 | Tragic 5.5% |
| Yaqui | 0.0 /100 | #297 | Tragic 5.5% |
| Immigrants | West Indies | 0.0 /100 | #298 | Tragic 5.6% |
| Guyanese | 0.0 /100 | #299 | Tragic 5.6% |
| Zimbabweans | 0.0 /100 | #300 | Tragic 5.6% |
| Hispanics or Latinos | 0.0 /100 | #301 | Tragic 5.6% |
| Guatemalans | 0.0 /100 | #302 | Tragic 5.6% |