Immigrants from Philippines vs Immigrants from Caribbean College, 1 year or more
COMPARE
Immigrants from Philippines
Immigrants from Caribbean
College, 1 year or more
College, 1 year or more Comparison
Immigrants from Philippines
Immigrants from Caribbean
58.7%
COLLEGE, 1 YEAR OR MORE
29.2/ 100
METRIC RATING
191st/ 347
METRIC RANK
51.4%
COLLEGE, 1 YEAR OR MORE
0.0/ 100
METRIC RATING
313th/ 347
METRIC RANK
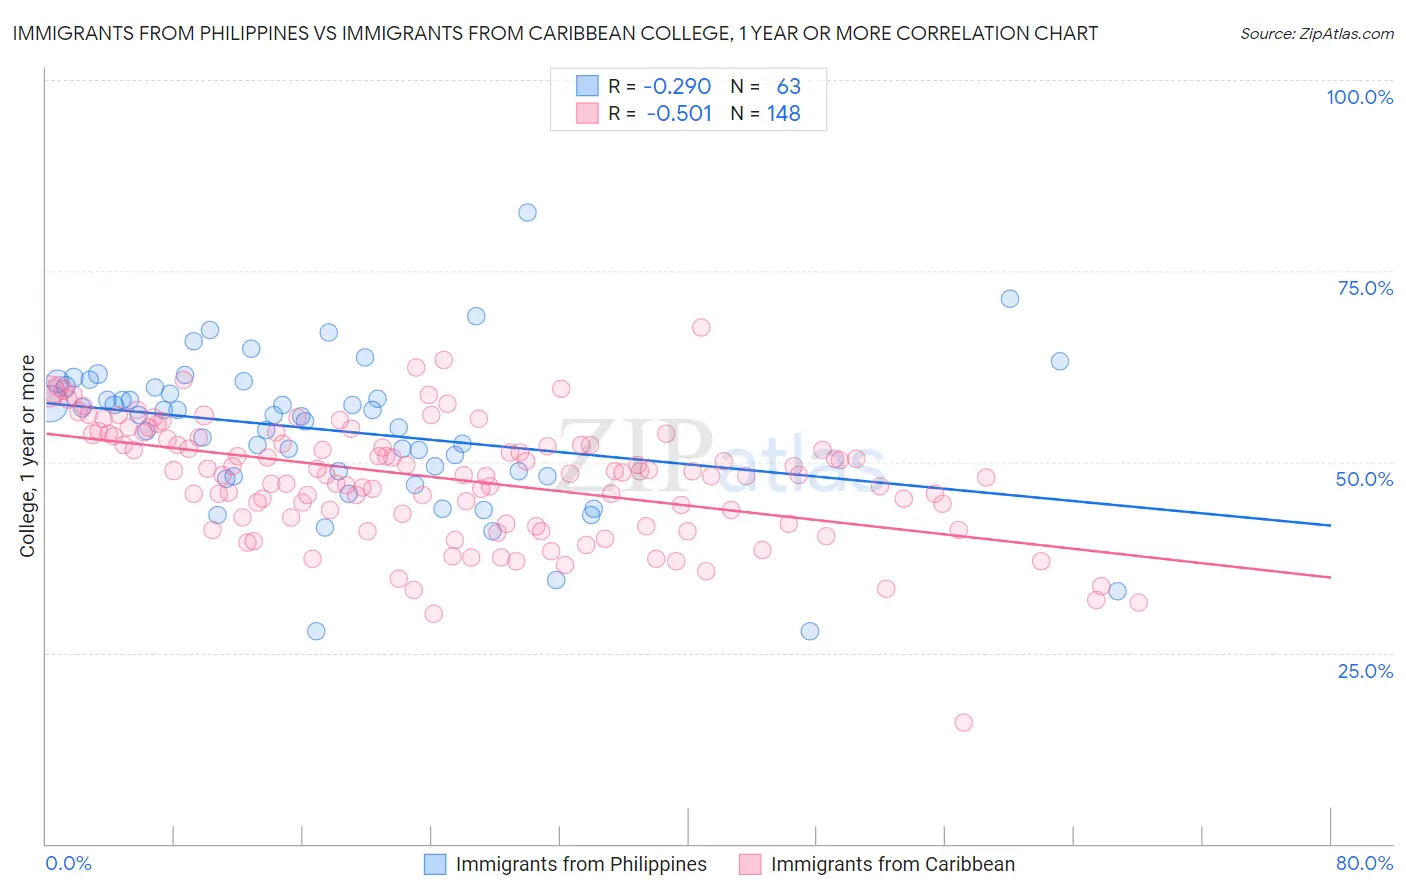
Immigrants from Philippines vs Immigrants from Caribbean College, 1 year or more Correlation Chart
The statistical analysis conducted on geographies consisting of 471,303,821 people shows a weak negative correlation between the proportion of Immigrants from Philippines and percentage of population with at least college, 1 year or more education in the United States with a correlation coefficient (R) of -0.290 and weighted average of 58.7%. Similarly, the statistical analysis conducted on geographies consisting of 450,060,902 people shows a substantial negative correlation between the proportion of Immigrants from Caribbean and percentage of population with at least college, 1 year or more education in the United States with a correlation coefficient (R) of -0.501 and weighted average of 51.4%, a difference of 14.2%.
College, 1 year or more Correlation Summary
| Measurement | Immigrants from Philippines | Immigrants from Caribbean |
| Minimum | 27.9% | 15.9% |
| Maximum | 82.6% | 67.7% |
| Range | 54.7% | 51.8% |
| Mean | 54.1% | 47.8% |
| Median | 56.1% | 48.6% |
| Interquartile 25% (IQ1) | 48.1% | 42.7% |
| Interquartile 75% (IQ3) | 59.9% | 53.3% |
| Interquartile Range (IQR) | 11.7% | 10.6% |
| Standard Deviation (Sample) | 9.9% | 7.8% |
| Standard Deviation (Population) | 9.8% | 7.7% |
Similar Demographics by College, 1 year or more
Demographics Similar to Immigrants from Philippines by College, 1 year or more
In terms of college, 1 year or more, the demographic groups most similar to Immigrants from Philippines are Colombian (58.7%, a difference of 0.10%), Peruvian (58.6%, a difference of 0.11%), Immigrants from Cameroon (58.8%, a difference of 0.13%), Uruguayan (58.8%, a difference of 0.17%), and Costa Rican (58.6%, a difference of 0.18%).
| Demographics | Rating | Rank | College, 1 year or more |
| Spaniards | 38.3 /100 | #184 | Fair 59.0% |
| South Americans | 35.9 /100 | #185 | Fair 59.0% |
| Scotch-Irish | 34.7 /100 | #186 | Fair 58.9% |
| Germans | 34.7 /100 | #187 | Fair 58.9% |
| French | 34.4 /100 | #188 | Fair 58.9% |
| Uruguayans | 31.8 /100 | #189 | Fair 58.8% |
| Immigrants | Cameroon | 31.2 /100 | #190 | Fair 58.8% |
| Immigrants | Philippines | 29.2 /100 | #191 | Fair 58.7% |
| Colombians | 27.6 /100 | #192 | Fair 58.7% |
| Peruvians | 27.5 /100 | #193 | Fair 58.6% |
| Costa Ricans | 26.4 /100 | #194 | Fair 58.6% |
| Dutch | 26.2 /100 | #195 | Fair 58.6% |
| Guamanians/Chamorros | 26.2 /100 | #196 | Fair 58.6% |
| Immigrants | Thailand | 26.0 /100 | #197 | Fair 58.6% |
| Immigrants | South Eastern Asia | 25.1 /100 | #198 | Fair 58.5% |
Demographics Similar to Immigrants from Caribbean by College, 1 year or more
In terms of college, 1 year or more, the demographic groups most similar to Immigrants from Caribbean are Pueblo (51.5%, a difference of 0.13%), Immigrants from Haiti (51.5%, a difference of 0.17%), Fijian (51.3%, a difference of 0.22%), Honduran (51.6%, a difference of 0.33%), and Guatemalan (51.2%, a difference of 0.45%).
| Demographics | Rating | Rank | College, 1 year or more |
| Mexican American Indians | 0.0 /100 | #306 | Tragic 51.9% |
| Immigrants | Portugal | 0.0 /100 | #307 | Tragic 51.9% |
| Salvadorans | 0.0 /100 | #308 | Tragic 51.8% |
| Apache | 0.0 /100 | #309 | Tragic 51.8% |
| Hondurans | 0.0 /100 | #310 | Tragic 51.6% |
| Immigrants | Haiti | 0.0 /100 | #311 | Tragic 51.5% |
| Pueblo | 0.0 /100 | #312 | Tragic 51.5% |
| Immigrants | Caribbean | 0.0 /100 | #313 | Tragic 51.4% |
| Fijians | 0.0 /100 | #314 | Tragic 51.3% |
| Guatemalans | 0.0 /100 | #315 | Tragic 51.2% |
| Cajuns | 0.0 /100 | #316 | Tragic 51.2% |
| Hispanics or Latinos | 0.0 /100 | #317 | Tragic 51.1% |
| Immigrants | Honduras | 0.0 /100 | #318 | Tragic 51.0% |
| Immigrants | El Salvador | 0.0 /100 | #319 | Tragic 51.0% |
| Kiowa | 0.0 /100 | #320 | Tragic 51.0% |