Immigrants from Philippines vs Luxembourger Male Poverty
COMPARE
Immigrants from Philippines
Luxembourger
Male Poverty
Male Poverty Comparison
Immigrants from Philippines
Luxembourgers
10.0%
MALE POVERTY
98.7/ 100
METRIC RATING
50th/ 347
METRIC RANK
9.5%
MALE POVERTY
99.8/ 100
METRIC RATING
16th/ 347
METRIC RANK
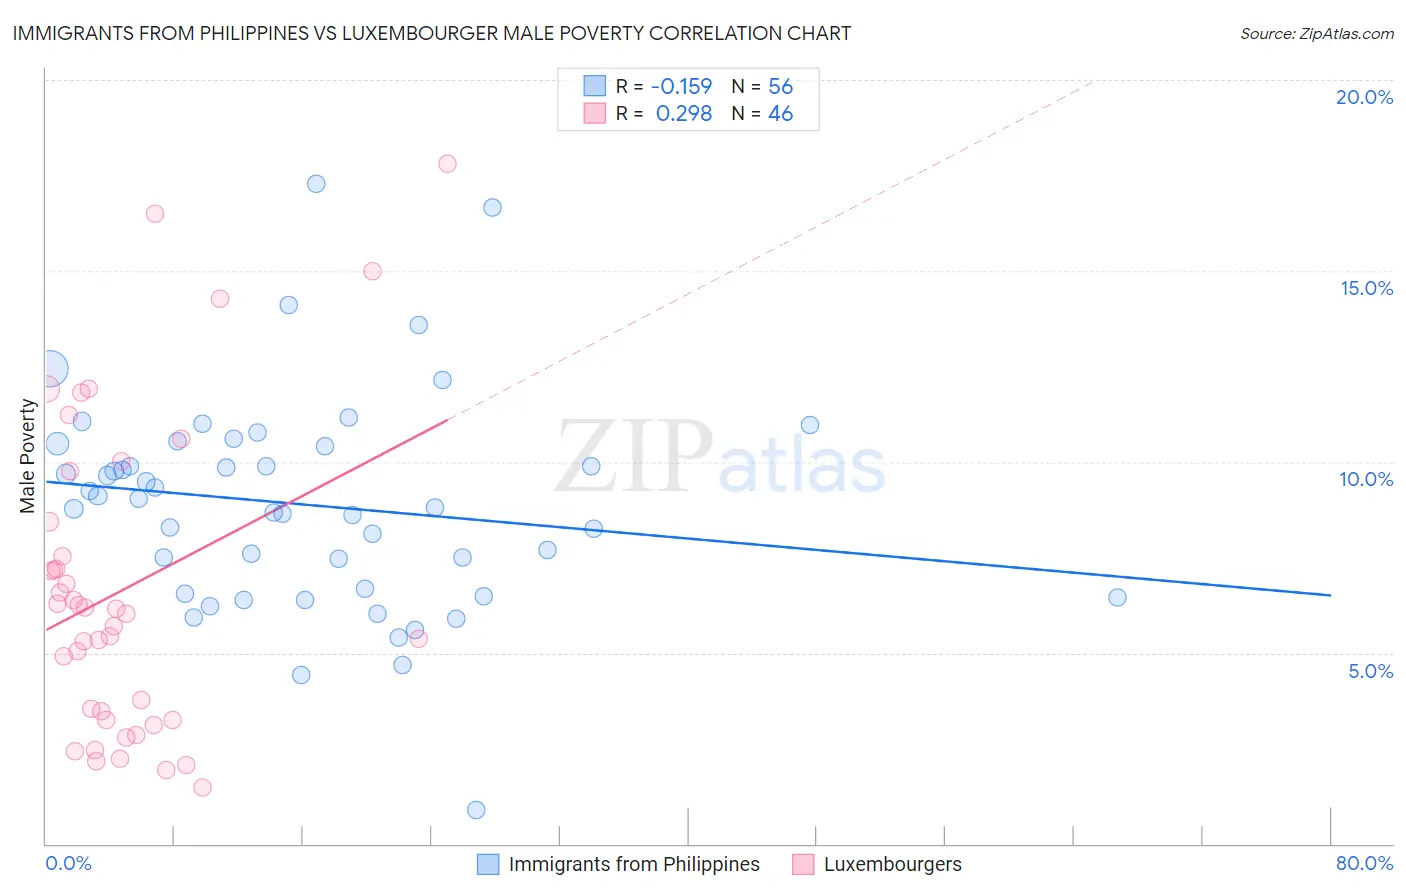
Immigrants from Philippines vs Luxembourger Male Poverty Correlation Chart
The statistical analysis conducted on geographies consisting of 470,810,616 people shows a poor negative correlation between the proportion of Immigrants from Philippines and poverty level among males in the United States with a correlation coefficient (R) of -0.159 and weighted average of 10.0%. Similarly, the statistical analysis conducted on geographies consisting of 144,631,125 people shows a weak positive correlation between the proportion of Luxembourgers and poverty level among males in the United States with a correlation coefficient (R) of 0.298 and weighted average of 9.5%, a difference of 5.0%.
Male Poverty Correlation Summary
| Measurement | Immigrants from Philippines | Luxembourger |
| Minimum | 0.87% | 1.5% |
| Maximum | 17.3% | 17.8% |
| Range | 16.4% | 16.3% |
| Mean | 8.9% | 6.7% |
| Median | 8.9% | 6.1% |
| Interquartile 25% (IQ1) | 6.6% | 3.2% |
| Interquartile 75% (IQ3) | 10.4% | 8.4% |
| Interquartile Range (IQR) | 3.8% | 5.2% |
| Standard Deviation (Sample) | 2.8% | 4.1% |
| Standard Deviation (Population) | 2.8% | 4.0% |
Similar Demographics by Male Poverty
Demographics Similar to Immigrants from Philippines by Male Poverty
In terms of male poverty, the demographic groups most similar to Immigrants from Philippines are Slovene (10.0%, a difference of 0.050%), Immigrants from Croatia (10.0%, a difference of 0.10%), Immigrants from Japan (10.0%, a difference of 0.14%), Immigrants from Singapore (10.0%, a difference of 0.15%), and Asian (10.0%, a difference of 0.19%).
| Demographics | Rating | Rank | Male Poverty |
| Immigrants | Moldova | 99.0 /100 | #43 | Exceptional 9.9% |
| Immigrants | Romania | 98.9 /100 | #44 | Exceptional 9.9% |
| Immigrants | Serbia | 98.9 /100 | #45 | Exceptional 10.0% |
| Turks | 98.9 /100 | #46 | Exceptional 10.0% |
| Immigrants | Singapore | 98.8 /100 | #47 | Exceptional 10.0% |
| Immigrants | Japan | 98.8 /100 | #48 | Exceptional 10.0% |
| Slovenes | 98.8 /100 | #49 | Exceptional 10.0% |
| Immigrants | Philippines | 98.7 /100 | #50 | Exceptional 10.0% |
| Immigrants | Croatia | 98.7 /100 | #51 | Exceptional 10.0% |
| Asians | 98.7 /100 | #52 | Exceptional 10.0% |
| Immigrants | Czechoslovakia | 98.6 /100 | #53 | Exceptional 10.0% |
| Immigrants | Austria | 98.5 /100 | #54 | Exceptional 10.0% |
| Germans | 98.3 /100 | #55 | Exceptional 10.1% |
| Immigrants | Bulgaria | 98.2 /100 | #56 | Exceptional 10.1% |
| Estonians | 98.1 /100 | #57 | Exceptional 10.1% |
Demographics Similar to Luxembourgers by Male Poverty
In terms of male poverty, the demographic groups most similar to Luxembourgers are Norwegian (9.5%, a difference of 0.13%), Lithuanian (9.5%, a difference of 0.30%), Immigrants from Hong Kong (9.6%, a difference of 0.48%), Bhutanese (9.5%, a difference of 0.52%), and Latvian (9.6%, a difference of 0.58%).
| Demographics | Rating | Rank | Male Poverty |
| Immigrants | South Central Asia | 99.9 /100 | #9 | Exceptional 9.3% |
| Bulgarians | 99.9 /100 | #10 | Exceptional 9.3% |
| Bolivians | 99.9 /100 | #11 | Exceptional 9.4% |
| Immigrants | Bolivia | 99.9 /100 | #12 | Exceptional 9.4% |
| Immigrants | Lithuania | 99.9 /100 | #13 | Exceptional 9.4% |
| Immigrants | North Macedonia | 99.8 /100 | #14 | Exceptional 9.4% |
| Bhutanese | 99.8 /100 | #15 | Exceptional 9.5% |
| Luxembourgers | 99.8 /100 | #16 | Exceptional 9.5% |
| Norwegians | 99.8 /100 | #17 | Exceptional 9.5% |
| Lithuanians | 99.8 /100 | #18 | Exceptional 9.5% |
| Immigrants | Hong Kong | 99.7 /100 | #19 | Exceptional 9.6% |
| Latvians | 99.7 /100 | #20 | Exceptional 9.6% |
| Immigrants | Scotland | 99.7 /100 | #21 | Exceptional 9.6% |
| Croatians | 99.7 /100 | #22 | Exceptional 9.6% |
| Italians | 99.7 /100 | #23 | Exceptional 9.6% |