Senegalese vs Lithuanian GED/Equivalency
COMPARE
Senegalese
Lithuanian
GED/Equivalency
GED/Equivalency Comparison
Senegalese
Lithuanians
84.0%
GED/EQUIVALENCY
1.9/ 100
METRIC RATING
241st/ 347
METRIC RANK
88.9%
GED/EQUIVALENCY
99.9/ 100
METRIC RATING
12th/ 347
METRIC RANK
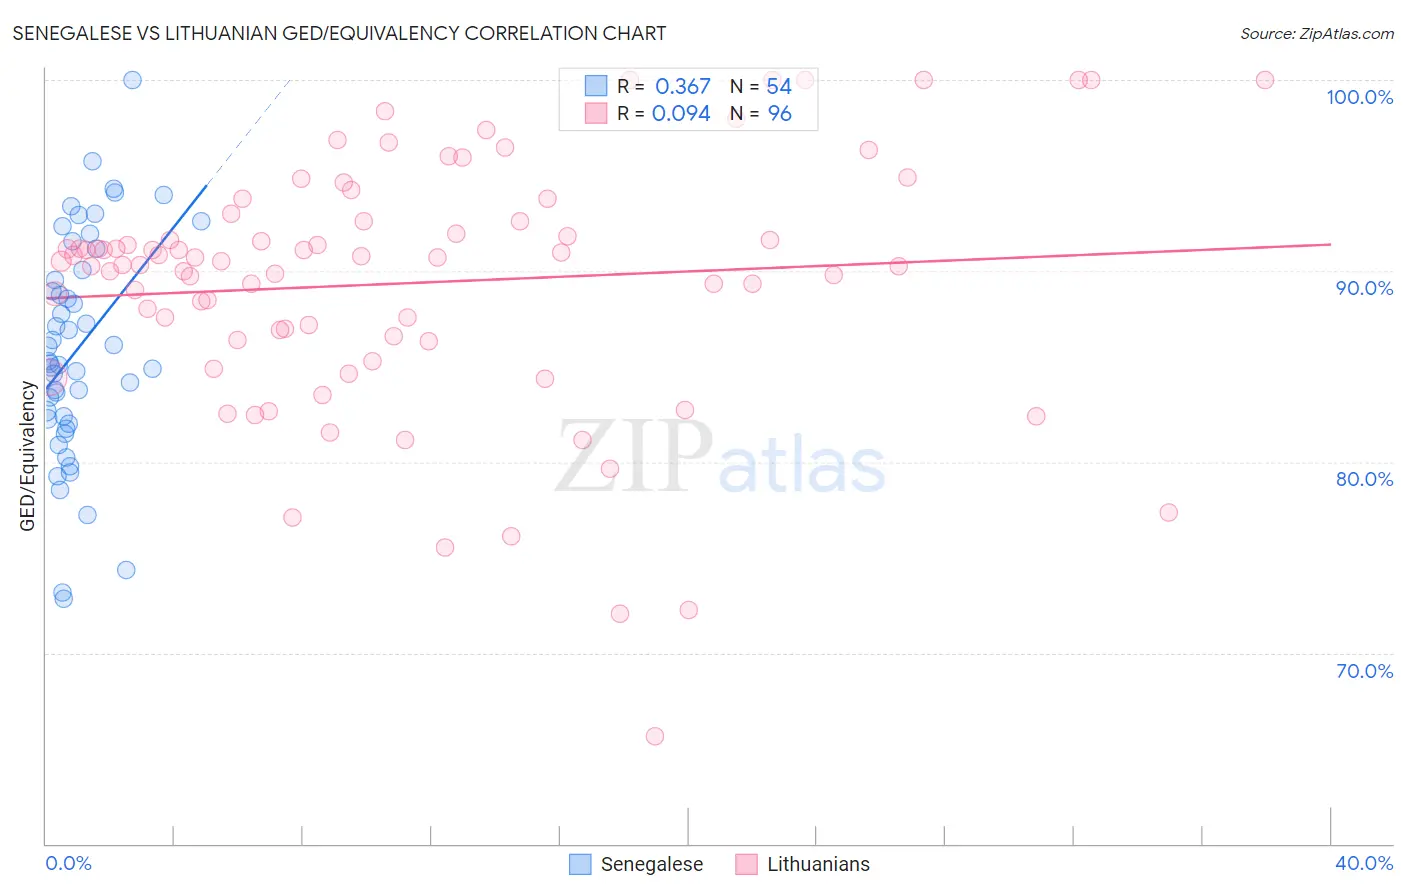
Senegalese vs Lithuanian GED/Equivalency Correlation Chart
The statistical analysis conducted on geographies consisting of 78,142,569 people shows a mild positive correlation between the proportion of Senegalese and percentage of population with at least ged/equivalency education in the United States with a correlation coefficient (R) of 0.367 and weighted average of 84.0%. Similarly, the statistical analysis conducted on geographies consisting of 421,947,832 people shows a slight positive correlation between the proportion of Lithuanians and percentage of population with at least ged/equivalency education in the United States with a correlation coefficient (R) of 0.094 and weighted average of 88.9%, a difference of 5.8%.
GED/Equivalency Correlation Summary
| Measurement | Senegalese | Lithuanian |
| Minimum | 72.9% | 65.6% |
| Maximum | 100.0% | 100.0% |
| Range | 27.1% | 34.4% |
| Mean | 85.9% | 89.4% |
| Median | 85.2% | 90.5% |
| Interquartile 25% (IQ1) | 82.3% | 86.5% |
| Interquartile 75% (IQ3) | 90.0% | 92.6% |
| Interquartile Range (IQR) | 7.8% | 6.1% |
| Standard Deviation (Sample) | 5.8% | 6.6% |
| Standard Deviation (Population) | 5.8% | 6.5% |
Similar Demographics by GED/Equivalency
Demographics Similar to Senegalese by GED/Equivalency
In terms of ged/equivalency, the demographic groups most similar to Senegalese are Sri Lankan (84.0%, a difference of 0.020%), Immigrants from South Eastern Asia (84.1%, a difference of 0.14%), Immigrants from Bahamas (84.2%, a difference of 0.15%), Immigrants from Peru (84.2%, a difference of 0.18%), and Cherokee (83.9%, a difference of 0.19%).
| Demographics | Rating | Rank | GED/Equivalency |
| Immigrants | Nigeria | 3.6 /100 | #234 | Tragic 84.3% |
| Ghanaians | 3.5 /100 | #235 | Tragic 84.3% |
| Immigrants | Eritrea | 3.5 /100 | #236 | Tragic 84.3% |
| Sub-Saharan Africans | 3.0 /100 | #237 | Tragic 84.2% |
| Immigrants | Peru | 2.7 /100 | #238 | Tragic 84.2% |
| Immigrants | Bahamas | 2.6 /100 | #239 | Tragic 84.2% |
| Immigrants | South Eastern Asia | 2.5 /100 | #240 | Tragic 84.1% |
| Senegalese | 1.9 /100 | #241 | Tragic 84.0% |
| Sri Lankans | 1.9 /100 | #242 | Tragic 84.0% |
| Cherokee | 1.3 /100 | #243 | Tragic 83.9% |
| Immigrants | Ghana | 1.3 /100 | #244 | Tragic 83.9% |
| Immigrants | Senegal | 1.2 /100 | #245 | Tragic 83.8% |
| Chickasaw | 1.2 /100 | #246 | Tragic 83.8% |
| Immigrants | Western Africa | 1.1 /100 | #247 | Tragic 83.8% |
| Blackfeet | 1.1 /100 | #248 | Tragic 83.8% |
Demographics Similar to Lithuanians by GED/Equivalency
In terms of ged/equivalency, the demographic groups most similar to Lithuanians are Immigrants from Iran (88.9%, a difference of 0.010%), Bulgarian (89.0%, a difference of 0.040%), Cypriot (88.9%, a difference of 0.040%), Okinawan (88.9%, a difference of 0.050%), and Norwegian (89.0%, a difference of 0.080%).
| Demographics | Rating | Rank | GED/Equivalency |
| Latvians | 100.0 /100 | #5 | Exceptional 89.2% |
| Thais | 100.0 /100 | #6 | Exceptional 89.1% |
| Eastern Europeans | 99.9 /100 | #7 | Exceptional 89.1% |
| Carpatho Rusyns | 99.9 /100 | #8 | Exceptional 89.1% |
| Chinese | 99.9 /100 | #9 | Exceptional 89.0% |
| Norwegians | 99.9 /100 | #10 | Exceptional 89.0% |
| Bulgarians | 99.9 /100 | #11 | Exceptional 89.0% |
| Lithuanians | 99.9 /100 | #12 | Exceptional 88.9% |
| Immigrants | Iran | 99.9 /100 | #13 | Exceptional 88.9% |
| Cypriots | 99.9 /100 | #14 | Exceptional 88.9% |
| Okinawans | 99.9 /100 | #15 | Exceptional 88.9% |
| Immigrants | Taiwan | 99.9 /100 | #16 | Exceptional 88.8% |
| Croatians | 99.9 /100 | #17 | Exceptional 88.8% |
| Slovenes | 99.9 /100 | #18 | Exceptional 88.8% |
| Swedes | 99.9 /100 | #19 | Exceptional 88.8% |