Immigrants from Peru vs Immigrants from Morocco College, Under 1 year
COMPARE
Immigrants from Peru
Immigrants from Morocco
College, Under 1 year
College, Under 1 year Comparison
Immigrants from Peru
Immigrants from Morocco
63.1%
COLLEGE, UNDER 1 YEAR
4.0/ 100
METRIC RATING
225th/ 347
METRIC RANK
66.5%
COLLEGE, UNDER 1 YEAR
81.7/ 100
METRIC RATING
147th/ 347
METRIC RANK
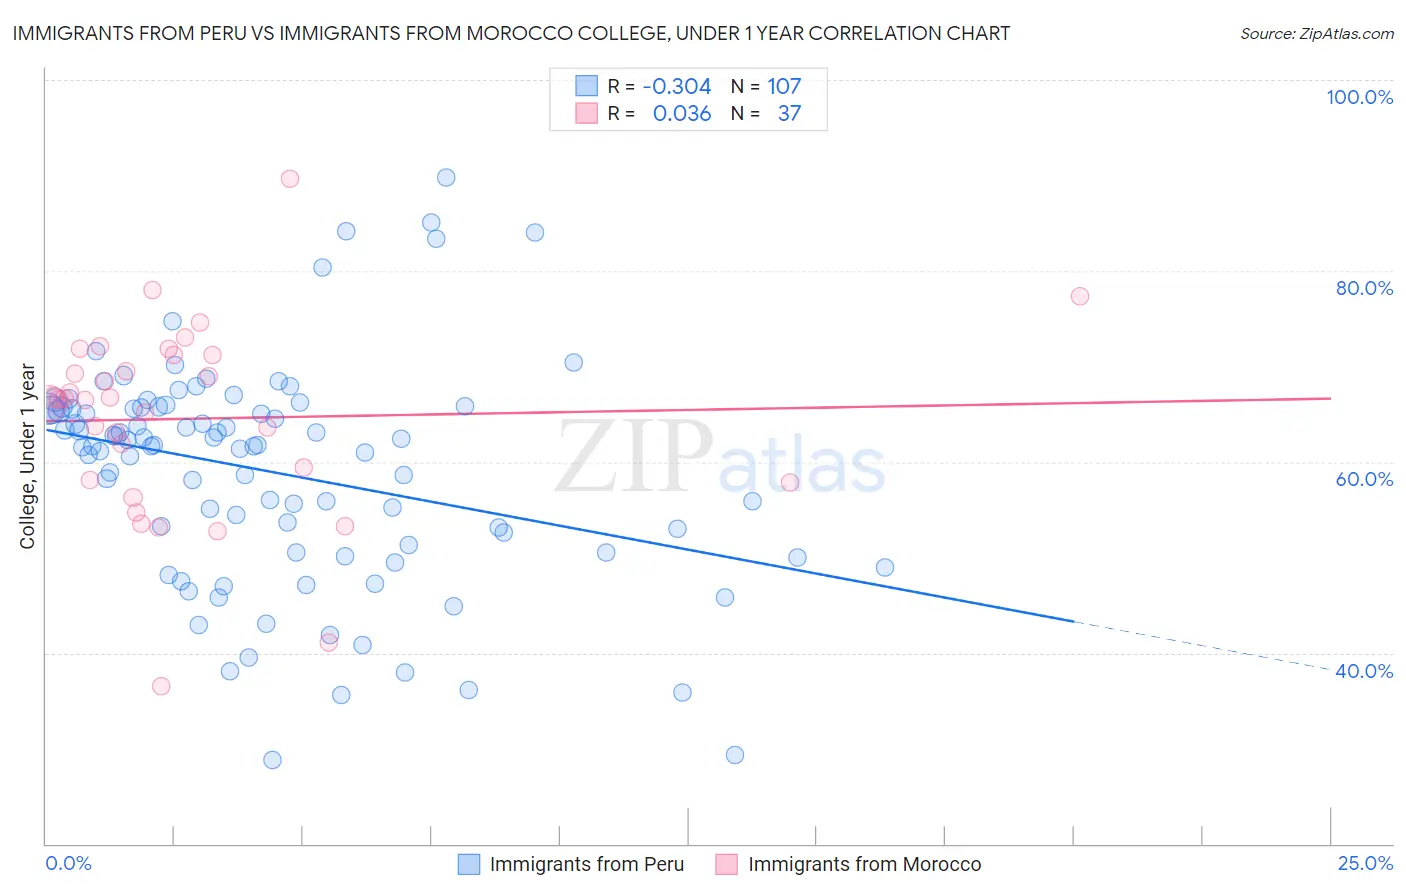
Immigrants from Peru vs Immigrants from Morocco College, Under 1 year Correlation Chart
The statistical analysis conducted on geographies consisting of 328,860,969 people shows a mild negative correlation between the proportion of Immigrants from Peru and percentage of population with at least college, under 1 year education in the United States with a correlation coefficient (R) of -0.304 and weighted average of 63.1%. Similarly, the statistical analysis conducted on geographies consisting of 178,912,438 people shows no correlation between the proportion of Immigrants from Morocco and percentage of population with at least college, under 1 year education in the United States with a correlation coefficient (R) of 0.036 and weighted average of 66.5%, a difference of 5.3%.
College, Under 1 year Correlation Summary
| Measurement | Immigrants from Peru | Immigrants from Morocco |
| Minimum | 28.8% | 36.5% |
| Maximum | 89.8% | 89.7% |
| Range | 61.0% | 53.2% |
| Mean | 58.9% | 64.5% |
| Median | 61.6% | 66.5% |
| Interquartile 25% (IQ1) | 50.5% | 58.0% |
| Interquartile 75% (IQ3) | 65.7% | 71.2% |
| Interquartile Range (IQR) | 15.3% | 13.2% |
| Standard Deviation (Sample) | 11.6% | 10.1% |
| Standard Deviation (Population) | 11.6% | 9.9% |
Similar Demographics by College, Under 1 year
Demographics Similar to Immigrants from Peru by College, Under 1 year
In terms of college, under 1 year, the demographic groups most similar to Immigrants from Peru are Immigrants from Colombia (63.1%, a difference of 0.020%), Subsaharan African (63.2%, a difference of 0.10%), Immigrants from Ghana (63.1%, a difference of 0.11%), Immigrants from Costa Rica (63.2%, a difference of 0.13%), and Samoan (63.0%, a difference of 0.22%).
| Demographics | Rating | Rank | College, Under 1 year |
| Immigrants | Panama | 5.7 /100 | #218 | Tragic 63.4% |
| Immigrants | Fiji | 5.7 /100 | #219 | Tragic 63.4% |
| Portuguese | 5.6 /100 | #220 | Tragic 63.4% |
| Cree | 5.2 /100 | #221 | Tragic 63.3% |
| Immigrants | Senegal | 5.0 /100 | #222 | Tragic 63.3% |
| Immigrants | Costa Rica | 4.5 /100 | #223 | Tragic 63.2% |
| Sub-Saharan Africans | 4.4 /100 | #224 | Tragic 63.2% |
| Immigrants | Peru | 4.0 /100 | #225 | Tragic 63.1% |
| Immigrants | Colombia | 4.0 /100 | #226 | Tragic 63.1% |
| Immigrants | Ghana | 3.7 /100 | #227 | Tragic 63.1% |
| Samoans | 3.3 /100 | #228 | Tragic 63.0% |
| Liberians | 3.2 /100 | #229 | Tragic 63.0% |
| Immigrants | Nonimmigrants | 3.0 /100 | #230 | Tragic 62.9% |
| Immigrants | Western Africa | 2.4 /100 | #231 | Tragic 62.8% |
| Osage | 2.2 /100 | #232 | Tragic 62.7% |
Demographics Similar to Immigrants from Morocco by College, Under 1 year
In terms of college, under 1 year, the demographic groups most similar to Immigrants from Morocco are Kenyan (66.5%, a difference of 0.0%), Immigrants from Kenya (66.5%, a difference of 0.010%), Immigrants from Germany (66.5%, a difference of 0.020%), Immigrants from Uganda (66.5%, a difference of 0.080%), and English (66.6%, a difference of 0.090%).
| Demographics | Rating | Rank | College, Under 1 year |
| Slavs | 85.9 /100 | #140 | Excellent 66.7% |
| Immigrants | Afghanistan | 85.1 /100 | #141 | Excellent 66.7% |
| English | 82.9 /100 | #142 | Excellent 66.6% |
| Immigrants | Uganda | 82.8 /100 | #143 | Excellent 66.5% |
| Immigrants | Germany | 82.0 /100 | #144 | Excellent 66.5% |
| Immigrants | Kenya | 81.8 /100 | #145 | Excellent 66.5% |
| Kenyans | 81.7 /100 | #146 | Excellent 66.5% |
| Immigrants | Morocco | 81.7 /100 | #147 | Excellent 66.5% |
| Taiwanese | 78.6 /100 | #148 | Good 66.4% |
| Immigrants | Venezuela | 77.9 /100 | #149 | Good 66.3% |
| Immigrants | Iraq | 77.1 /100 | #150 | Good 66.3% |
| Immigrants | Sudan | 76.0 /100 | #151 | Good 66.2% |
| Sudanese | 74.1 /100 | #152 | Good 66.2% |
| Belgians | 73.7 /100 | #153 | Good 66.2% |
| Immigrants | Eritrea | 71.9 /100 | #154 | Good 66.1% |