Immigrants from Panama vs Immigrants from Africa College, Under 1 year
COMPARE
Immigrants from Panama
Immigrants from Africa
College, Under 1 year
College, Under 1 year Comparison
Immigrants from Panama
Immigrants from Africa
63.4%
COLLEGE, UNDER 1 YEAR
5.7/ 100
METRIC RATING
218th/ 347
METRIC RANK
65.3%
COLLEGE, UNDER 1 YEAR
44.7/ 100
METRIC RATING
182nd/ 347
METRIC RANK
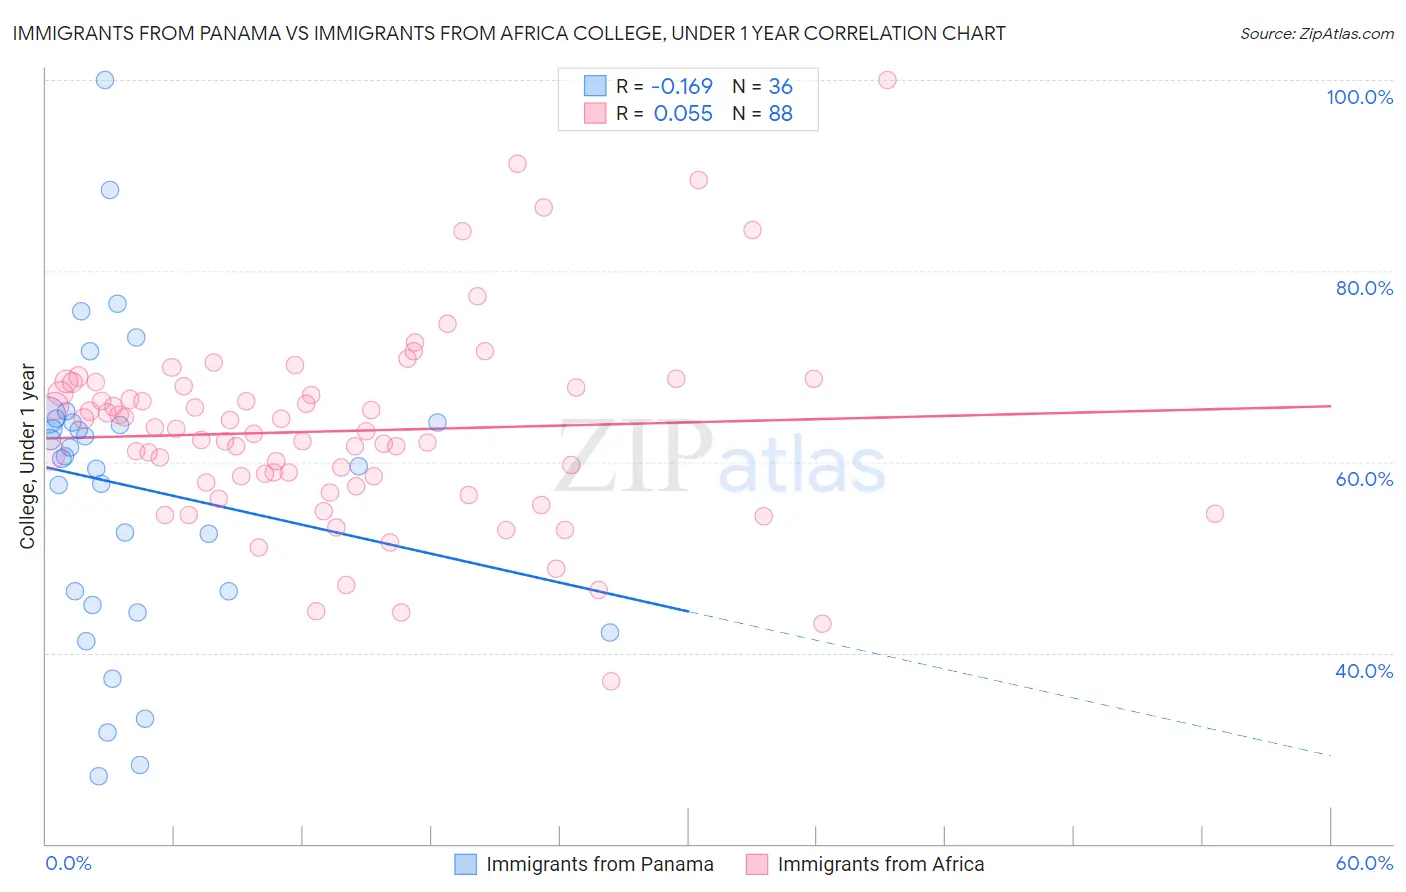
Immigrants from Panama vs Immigrants from Africa College, Under 1 year Correlation Chart
The statistical analysis conducted on geographies consisting of 221,184,524 people shows a poor negative correlation between the proportion of Immigrants from Panama and percentage of population with at least college, under 1 year education in the United States with a correlation coefficient (R) of -0.169 and weighted average of 63.4%. Similarly, the statistical analysis conducted on geographies consisting of 469,444,786 people shows a slight positive correlation between the proportion of Immigrants from Africa and percentage of population with at least college, under 1 year education in the United States with a correlation coefficient (R) of 0.055 and weighted average of 65.3%, a difference of 2.9%.
College, Under 1 year Correlation Summary
| Measurement | Immigrants from Panama | Immigrants from Africa |
| Minimum | 27.1% | 37.0% |
| Maximum | 100.0% | 100.0% |
| Range | 72.9% | 63.0% |
| Mean | 57.5% | 63.2% |
| Median | 60.4% | 63.1% |
| Interquartile 25% (IQ1) | 45.7% | 57.7% |
| Interquartile 75% (IQ3) | 64.4% | 67.9% |
| Interquartile Range (IQR) | 18.6% | 10.2% |
| Standard Deviation (Sample) | 16.0% | 10.4% |
| Standard Deviation (Population) | 15.8% | 10.3% |
Similar Demographics by College, Under 1 year
Demographics Similar to Immigrants from Panama by College, Under 1 year
In terms of college, under 1 year, the demographic groups most similar to Immigrants from Panama are Immigrants from Fiji (63.4%, a difference of 0.010%), Immigrants from Uruguay (63.4%, a difference of 0.020%), Portuguese (63.4%, a difference of 0.030%), Cree (63.3%, a difference of 0.11%), and Immigrants from Senegal (63.3%, a difference of 0.16%).
| Demographics | Rating | Rank | College, Under 1 year |
| Native Hawaiians | 10.6 /100 | #211 | Poor 63.9% |
| Immigrants | Middle Africa | 10.5 /100 | #212 | Poor 63.9% |
| Immigrants | South America | 9.1 /100 | #213 | Tragic 63.8% |
| Immigrants | Nigeria | 8.8 /100 | #214 | Tragic 63.7% |
| Senegalese | 7.7 /100 | #215 | Tragic 63.6% |
| Hmong | 6.8 /100 | #216 | Tragic 63.5% |
| Immigrants | Uruguay | 5.8 /100 | #217 | Tragic 63.4% |
| Immigrants | Panama | 5.7 /100 | #218 | Tragic 63.4% |
| Immigrants | Fiji | 5.7 /100 | #219 | Tragic 63.4% |
| Portuguese | 5.6 /100 | #220 | Tragic 63.4% |
| Cree | 5.2 /100 | #221 | Tragic 63.3% |
| Immigrants | Senegal | 5.0 /100 | #222 | Tragic 63.3% |
| Immigrants | Costa Rica | 4.5 /100 | #223 | Tragic 63.2% |
| Sub-Saharan Africans | 4.4 /100 | #224 | Tragic 63.2% |
| Immigrants | Peru | 4.0 /100 | #225 | Tragic 63.1% |
Demographics Similar to Immigrants from Africa by College, Under 1 year
In terms of college, under 1 year, the demographic groups most similar to Immigrants from Africa are Spaniard (65.3%, a difference of 0.040%), Dutch (65.3%, a difference of 0.060%), Immigrants from Poland (65.2%, a difference of 0.10%), Bermudan (65.2%, a difference of 0.12%), and Sri Lankan (65.2%, a difference of 0.13%).
| Demographics | Rating | Rank | College, Under 1 year |
| Scotch-Irish | 49.5 /100 | #175 | Average 65.4% |
| French | 48.9 /100 | #176 | Average 65.4% |
| Immigrants | North Macedonia | 48.6 /100 | #177 | Average 65.4% |
| German Russians | 48.3 /100 | #178 | Average 65.4% |
| Guamanians/Chamorros | 48.2 /100 | #179 | Average 65.4% |
| Dutch | 46.1 /100 | #180 | Average 65.3% |
| Spaniards | 45.5 /100 | #181 | Average 65.3% |
| Immigrants | Africa | 44.7 /100 | #182 | Average 65.3% |
| Immigrants | Poland | 42.6 /100 | #183 | Average 65.2% |
| Bermudans | 42.0 /100 | #184 | Average 65.2% |
| Sri Lankans | 41.7 /100 | #185 | Average 65.2% |
| Immigrants | Sierra Leone | 39.7 /100 | #186 | Fair 65.1% |
| Immigrants | Southern Europe | 34.3 /100 | #187 | Fair 64.9% |
| Immigrants | Albania | 32.0 /100 | #188 | Fair 64.9% |
| Spanish | 31.6 /100 | #189 | Fair 64.9% |