Immigrants from Norway vs Immigrants from Indonesia College, 1 year or more
COMPARE
Immigrants from Norway
Immigrants from Indonesia
College, 1 year or more
College, 1 year or more Comparison
Immigrants from Norway
Immigrants from Indonesia
64.7%
COLLEGE, 1 YEAR OR MORE
99.9/ 100
METRIC RATING
44th/ 347
METRIC RANK
63.5%
COLLEGE, 1 YEAR OR MORE
99.5/ 100
METRIC RATING
62nd/ 347
METRIC RANK
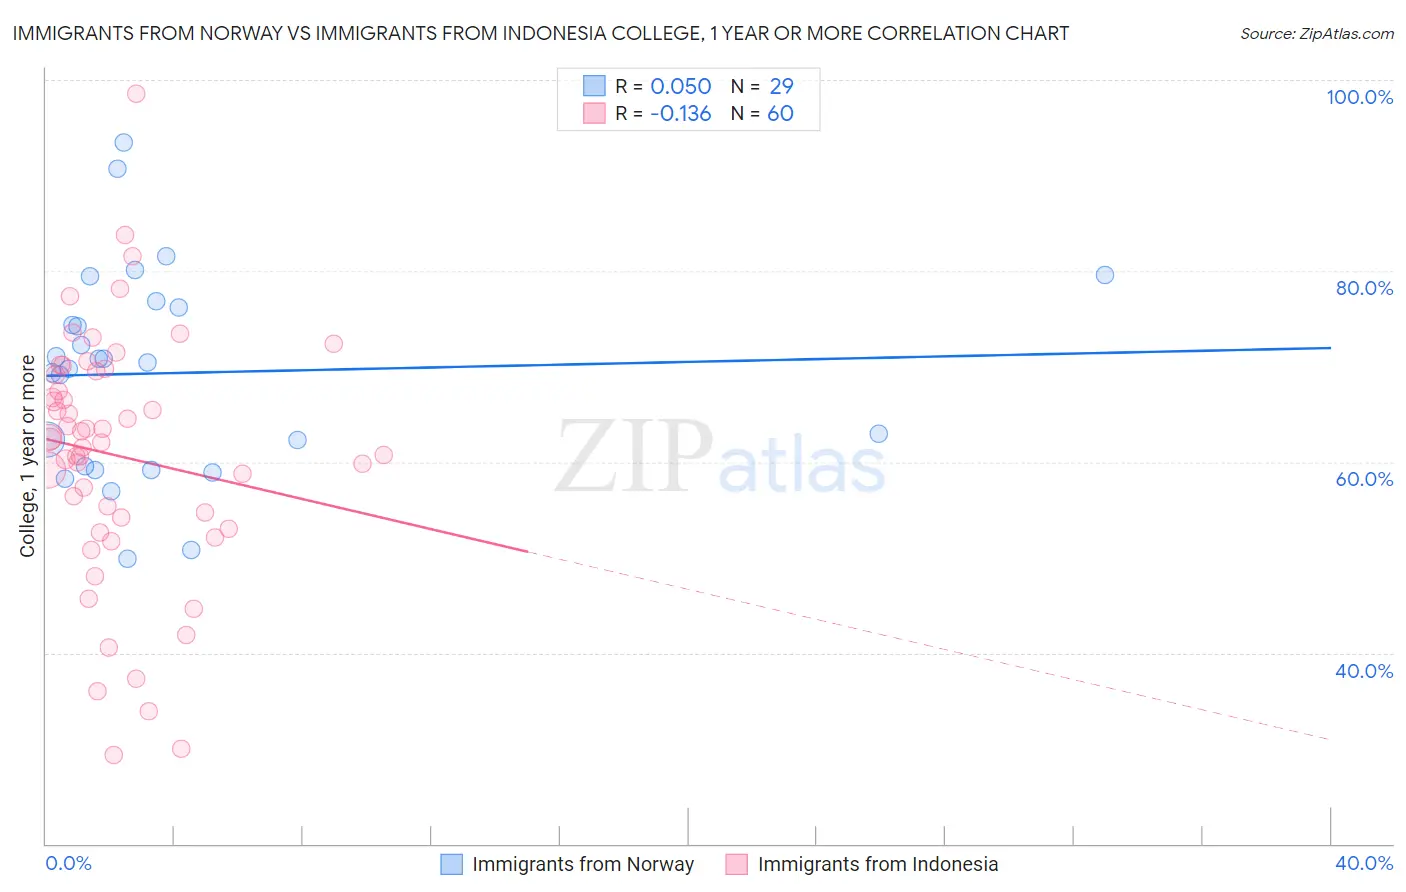
Immigrants from Norway vs Immigrants from Indonesia College, 1 year or more Correlation Chart
The statistical analysis conducted on geographies consisting of 116,716,420 people shows no correlation between the proportion of Immigrants from Norway and percentage of population with at least college, 1 year or more education in the United States with a correlation coefficient (R) of 0.050 and weighted average of 64.7%. Similarly, the statistical analysis conducted on geographies consisting of 215,783,142 people shows a poor negative correlation between the proportion of Immigrants from Indonesia and percentage of population with at least college, 1 year or more education in the United States with a correlation coefficient (R) of -0.136 and weighted average of 63.5%, a difference of 1.9%.
College, 1 year or more Correlation Summary
| Measurement | Immigrants from Norway | Immigrants from Indonesia |
| Minimum | 49.9% | 29.3% |
| Maximum | 93.5% | 98.6% |
| Range | 43.6% | 69.3% |
| Mean | 69.3% | 60.6% |
| Median | 70.3% | 62.2% |
| Interquartile 25% (IQ1) | 59.4% | 53.6% |
| Interquartile 75% (IQ3) | 76.5% | 69.3% |
| Interquartile Range (IQR) | 17.1% | 15.7% |
| Standard Deviation (Sample) | 10.7% | 13.2% |
| Standard Deviation (Population) | 10.6% | 13.1% |
Demographics Similar to Immigrants from Norway and Immigrants from Indonesia by College, 1 year or more
In terms of college, 1 year or more, the demographic groups most similar to Immigrants from Norway are Immigrants from Russia (64.7%, a difference of 0.020%), Immigrants from Lithuania (64.6%, a difference of 0.17%), Bhutanese (64.6%, a difference of 0.18%), Australian (64.6%, a difference of 0.18%), and Immigrants from Bulgaria (64.6%, a difference of 0.21%). Similarly, the demographic groups most similar to Immigrants from Indonesia are Bolivian (63.5%, a difference of 0.010%), Immigrants from Kazakhstan (63.6%, a difference of 0.12%), Immigrants from Scotland (63.4%, a difference of 0.13%), Immigrants from Serbia (63.8%, a difference of 0.39%), and Immigrants from Asia (64.0%, a difference of 0.74%).
| Demographics | Rating | Rank | College, 1 year or more |
| Immigrants | Russia | 99.9 /100 | #43 | Exceptional 64.7% |
| Immigrants | Norway | 99.9 /100 | #44 | Exceptional 64.7% |
| Immigrants | Lithuania | 99.9 /100 | #45 | Exceptional 64.6% |
| Bhutanese | 99.9 /100 | #46 | Exceptional 64.6% |
| Australians | 99.9 /100 | #47 | Exceptional 64.6% |
| Immigrants | Bulgaria | 99.9 /100 | #48 | Exceptional 64.6% |
| New Zealanders | 99.9 /100 | #49 | Exceptional 64.6% |
| Immigrants | Austria | 99.8 /100 | #50 | Exceptional 64.4% |
| Immigrants | Malaysia | 99.8 /100 | #51 | Exceptional 64.3% |
| Immigrants | Netherlands | 99.8 /100 | #52 | Exceptional 64.2% |
| Asians | 99.8 /100 | #53 | Exceptional 64.2% |
| Zimbabweans | 99.8 /100 | #54 | Exceptional 64.2% |
| Immigrants | Belarus | 99.7 /100 | #55 | Exceptional 64.1% |
| Immigrants | Czechoslovakia | 99.7 /100 | #56 | Exceptional 64.1% |
| South Africans | 99.7 /100 | #57 | Exceptional 64.1% |
| Immigrants | Asia | 99.7 /100 | #58 | Exceptional 64.0% |
| Immigrants | Serbia | 99.6 /100 | #59 | Exceptional 63.8% |
| Immigrants | Kazakhstan | 99.5 /100 | #60 | Exceptional 63.6% |
| Bolivians | 99.5 /100 | #61 | Exceptional 63.5% |
| Immigrants | Indonesia | 99.5 /100 | #62 | Exceptional 63.5% |
| Immigrants | Scotland | 99.4 /100 | #63 | Exceptional 63.4% |