Immigrants from Norway vs Guamanian/Chamorro Seniors Poverty Over the Age of 65
COMPARE
Immigrants from Norway
Guamanian/Chamorro
Seniors Poverty Over the Age of 65
Seniors Poverty Over the Age of 65 Comparison
Immigrants from Norway
Guamanians/Chamorros
10.5%
SENIORS POVERTY OVER THE AGE OF 65
86.5/ 100
METRIC RATING
135th/ 347
METRIC RANK
10.5%
SENIORS POVERTY OVER THE AGE OF 65
87.5/ 100
METRIC RATING
133rd/ 347
METRIC RANK
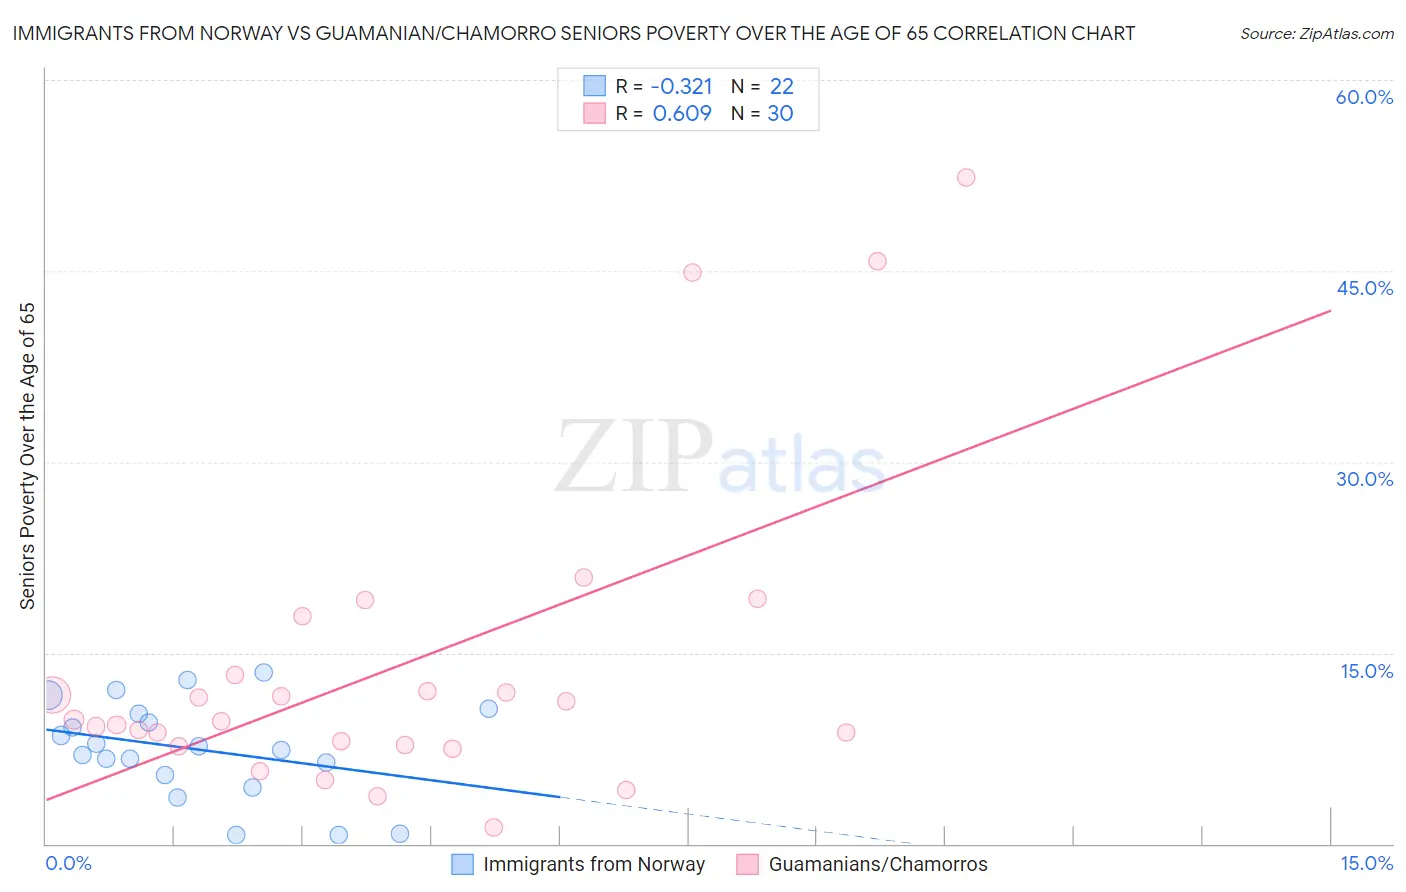
Immigrants from Norway vs Guamanian/Chamorro Seniors Poverty Over the Age of 65 Correlation Chart
The statistical analysis conducted on geographies consisting of 116,590,861 people shows a mild negative correlation between the proportion of Immigrants from Norway and poverty level among seniors over the age of 65 in the United States with a correlation coefficient (R) of -0.321 and weighted average of 10.5%. Similarly, the statistical analysis conducted on geographies consisting of 221,115,754 people shows a significant positive correlation between the proportion of Guamanians/Chamorros and poverty level among seniors over the age of 65 in the United States with a correlation coefficient (R) of 0.609 and weighted average of 10.5%, a difference of 0.22%.
Seniors Poverty Over the Age of 65 Correlation Summary
| Measurement | Immigrants from Norway | Guamanian/Chamorro |
| Minimum | 0.71% | 1.2% |
| Maximum | 13.4% | 52.4% |
| Range | 12.7% | 51.1% |
| Mean | 7.4% | 13.9% |
| Median | 7.5% | 9.7% |
| Interquartile 25% (IQ1) | 5.4% | 7.7% |
| Interquartile 75% (IQ3) | 10.2% | 13.2% |
| Interquartile Range (IQR) | 4.9% | 5.5% |
| Standard Deviation (Sample) | 3.8% | 12.3% |
| Standard Deviation (Population) | 3.7% | 12.1% |
Demographics Similar to Immigrants from Norway and Guamanians/Chamorros by Seniors Poverty Over the Age of 65
In terms of seniors poverty over the age of 65, the demographic groups most similar to Immigrants from Norway are Immigrants from Serbia (10.5%, a difference of 0.010%), Sierra Leonean (10.5%, a difference of 0.060%), Immigrants from Turkey (10.5%, a difference of 0.25%), Egyptian (10.5%, a difference of 0.27%), and Immigrants from Australia (10.5%, a difference of 0.27%). Similarly, the demographic groups most similar to Guamanians/Chamorros are Immigrants from Turkey (10.5%, a difference of 0.040%), Egyptian (10.5%, a difference of 0.050%), Sierra Leonean (10.5%, a difference of 0.15%), Immigrants from Iran (10.4%, a difference of 0.20%), and Immigrants from Oceania (10.4%, a difference of 0.20%).
| Demographics | Rating | Rank | Seniors Poverty Over the Age of 65 |
| Asians | 89.9 /100 | #124 | Excellent 10.4% |
| Immigrants | Philippines | 89.4 /100 | #125 | Excellent 10.4% |
| Immigrants | Hungary | 89.1 /100 | #126 | Excellent 10.4% |
| Cambodians | 89.1 /100 | #127 | Excellent 10.4% |
| Ottawa | 88.5 /100 | #128 | Excellent 10.4% |
| Immigrants | Iran | 88.4 /100 | #129 | Excellent 10.4% |
| Immigrants | Oceania | 88.4 /100 | #130 | Excellent 10.4% |
| Egyptians | 87.8 /100 | #131 | Excellent 10.5% |
| Immigrants | Turkey | 87.7 /100 | #132 | Excellent 10.5% |
| Guamanians/Chamorros | 87.5 /100 | #133 | Excellent 10.5% |
| Sierra Leoneans | 86.8 /100 | #134 | Excellent 10.5% |
| Immigrants | Norway | 86.5 /100 | #135 | Excellent 10.5% |
| Immigrants | Serbia | 86.4 /100 | #136 | Excellent 10.5% |
| Immigrants | Australia | 85.1 /100 | #137 | Excellent 10.5% |
| Immigrants | Latvia | 84.7 /100 | #138 | Excellent 10.5% |
| Portuguese | 84.1 /100 | #139 | Excellent 10.5% |
| Immigrants | Kenya | 83.4 /100 | #140 | Excellent 10.5% |
| Immigrants | Europe | 83.3 /100 | #141 | Excellent 10.5% |
| Osage | 82.8 /100 | #142 | Excellent 10.6% |
| Immigrants | Asia | 80.8 /100 | #143 | Excellent 10.6% |
| Iraqis | 80.7 /100 | #144 | Excellent 10.6% |