Immigrants from North America vs Kenyan Master's Degree
COMPARE
Immigrants from North America
Kenyan
Master's Degree
Master's Degree Comparison
Immigrants from North America
Kenyans
17.2%
MASTER'S DEGREE
99.1/ 100
METRIC RATING
92nd/ 347
METRIC RANK
15.3%
MASTER'S DEGREE
70.3/ 100
METRIC RATING
160th/ 347
METRIC RANK
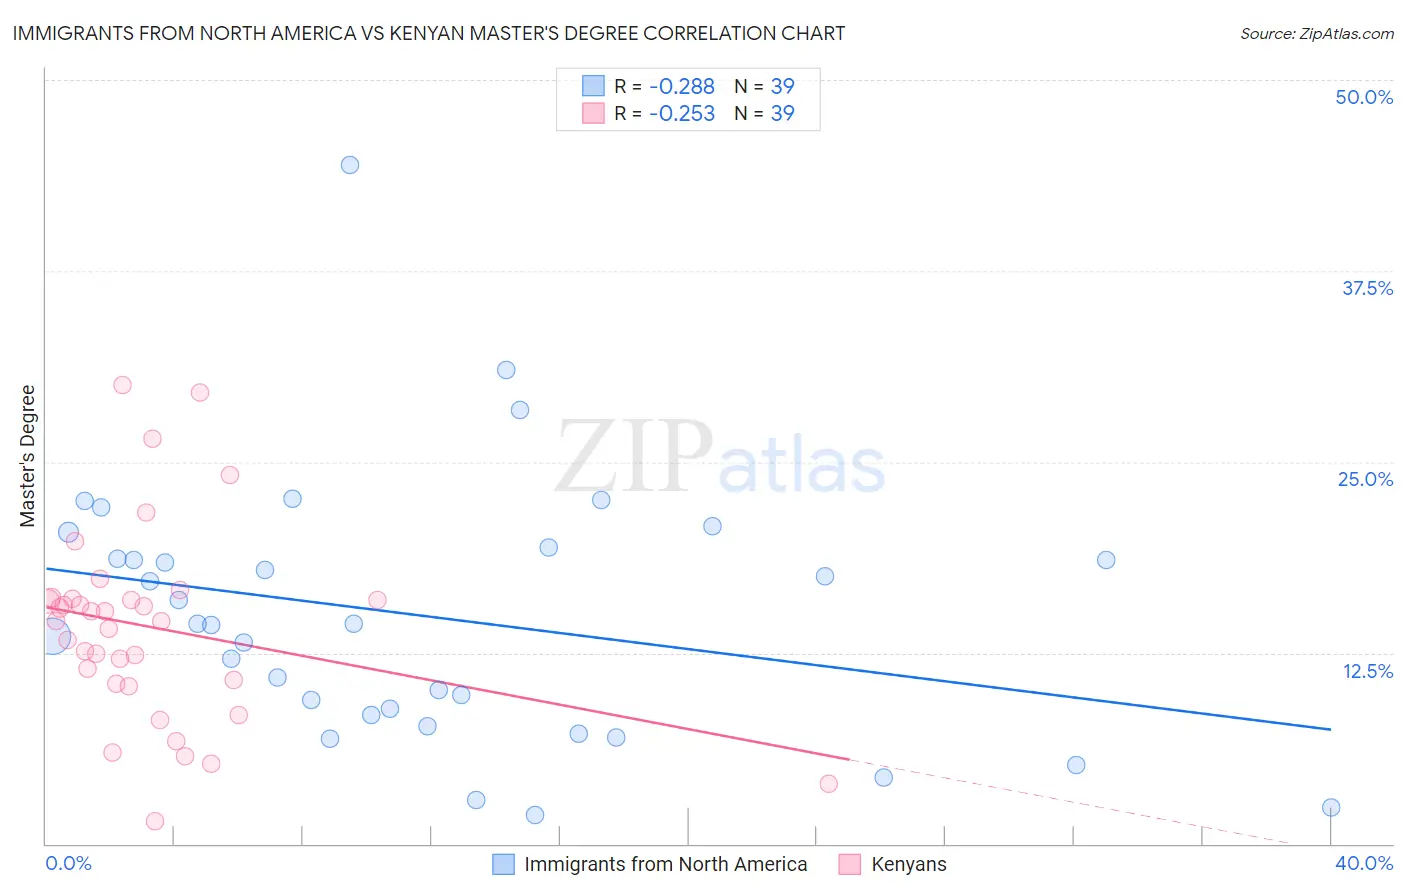
Immigrants from North America vs Kenyan Master's Degree Correlation Chart
The statistical analysis conducted on geographies consisting of 462,287,354 people shows a weak negative correlation between the proportion of Immigrants from North America and percentage of population with at least master's degree education in the United States with a correlation coefficient (R) of -0.288 and weighted average of 17.2%. Similarly, the statistical analysis conducted on geographies consisting of 168,212,419 people shows a weak negative correlation between the proportion of Kenyans and percentage of population with at least master's degree education in the United States with a correlation coefficient (R) of -0.253 and weighted average of 15.3%, a difference of 12.0%.
Master's Degree Correlation Summary
| Measurement | Immigrants from North America | Kenyan |
| Minimum | 1.9% | 1.5% |
| Maximum | 44.5% | 30.0% |
| Range | 42.5% | 28.5% |
| Mean | 14.9% | 14.2% |
| Median | 14.4% | 14.6% |
| Interquartile 25% (IQ1) | 8.4% | 10.5% |
| Interquartile 75% (IQ3) | 19.4% | 16.0% |
| Interquartile Range (IQR) | 11.0% | 5.6% |
| Standard Deviation (Sample) | 8.6% | 6.4% |
| Standard Deviation (Population) | 8.5% | 6.3% |
Similar Demographics by Master's Degree
Demographics Similar to Immigrants from North America by Master's Degree
In terms of master's degree, the demographic groups most similar to Immigrants from North America are Romanian (17.2%, a difference of 0.050%), Immigrants from Italy (17.2%, a difference of 0.060%), Immigrants from Egypt (17.2%, a difference of 0.12%), Bhutanese (17.2%, a difference of 0.14%), and Ugandan (17.1%, a difference of 0.19%).
| Demographics | Rating | Rank | Master's Degree |
| Immigrants | Brazil | 99.4 /100 | #85 | Exceptional 17.4% |
| Immigrants | Croatia | 99.3 /100 | #86 | Exceptional 17.3% |
| Maltese | 99.3 /100 | #87 | Exceptional 17.3% |
| Immigrants | Canada | 99.2 /100 | #88 | Exceptional 17.2% |
| Bhutanese | 99.1 /100 | #89 | Exceptional 17.2% |
| Immigrants | Egypt | 99.1 /100 | #90 | Exceptional 17.2% |
| Romanians | 99.1 /100 | #91 | Exceptional 17.2% |
| Immigrants | North America | 99.1 /100 | #92 | Exceptional 17.2% |
| Immigrants | Italy | 99.1 /100 | #93 | Exceptional 17.2% |
| Ugandans | 99.0 /100 | #94 | Exceptional 17.1% |
| Immigrants | Morocco | 98.9 /100 | #95 | Exceptional 17.1% |
| Immigrants | Northern Africa | 98.9 /100 | #96 | Exceptional 17.1% |
| Immigrants | England | 98.8 /100 | #97 | Exceptional 17.0% |
| Immigrants | Ukraine | 98.8 /100 | #98 | Exceptional 17.0% |
| Laotians | 98.8 /100 | #99 | Exceptional 17.0% |
Demographics Similar to Kenyans by Master's Degree
In terms of master's degree, the demographic groups most similar to Kenyans are Luxembourger (15.3%, a difference of 0.11%), Immigrants from Poland (15.4%, a difference of 0.18%), Immigrants from Cameroon (15.4%, a difference of 0.22%), Sudanese (15.3%, a difference of 0.23%), and Peruvian (15.3%, a difference of 0.24%).
| Demographics | Rating | Rank | Master's Degree |
| Icelanders | 76.8 /100 | #153 | Good 15.5% |
| Immigrants | South America | 76.3 /100 | #154 | Good 15.5% |
| Immigrants | Bangladesh | 76.1 /100 | #155 | Good 15.5% |
| Bermudans | 73.9 /100 | #156 | Good 15.4% |
| Immigrants | Cameroon | 71.7 /100 | #157 | Good 15.4% |
| Immigrants | Poland | 71.5 /100 | #158 | Good 15.4% |
| Luxembourgers | 71.0 /100 | #159 | Good 15.3% |
| Kenyans | 70.3 /100 | #160 | Good 15.3% |
| Sudanese | 68.7 /100 | #161 | Good 15.3% |
| Peruvians | 68.7 /100 | #162 | Good 15.3% |
| Uruguayans | 67.1 /100 | #163 | Good 15.3% |
| Colombians | 66.9 /100 | #164 | Good 15.3% |
| Immigrants | Kenya | 66.6 /100 | #165 | Good 15.3% |
| Swedes | 66.1 /100 | #166 | Good 15.2% |
| Senegalese | 65.6 /100 | #167 | Good 15.2% |