Immigrants from North America vs Immigrants from Latin America Child Poverty Under the Age of 16
COMPARE
Immigrants from North America
Immigrants from Latin America
Child Poverty Under the Age of 16
Child Poverty Under the Age of 16 Comparison
Immigrants from North America
Immigrants from Latin America
14.6%
CHILD POVERTY UNDER THE AGE OF 16
96.7/ 100
METRIC RATING
91st/ 347
METRIC RANK
20.5%
CHILD POVERTY UNDER THE AGE OF 16
0.0/ 100
METRIC RATING
292nd/ 347
METRIC RANK
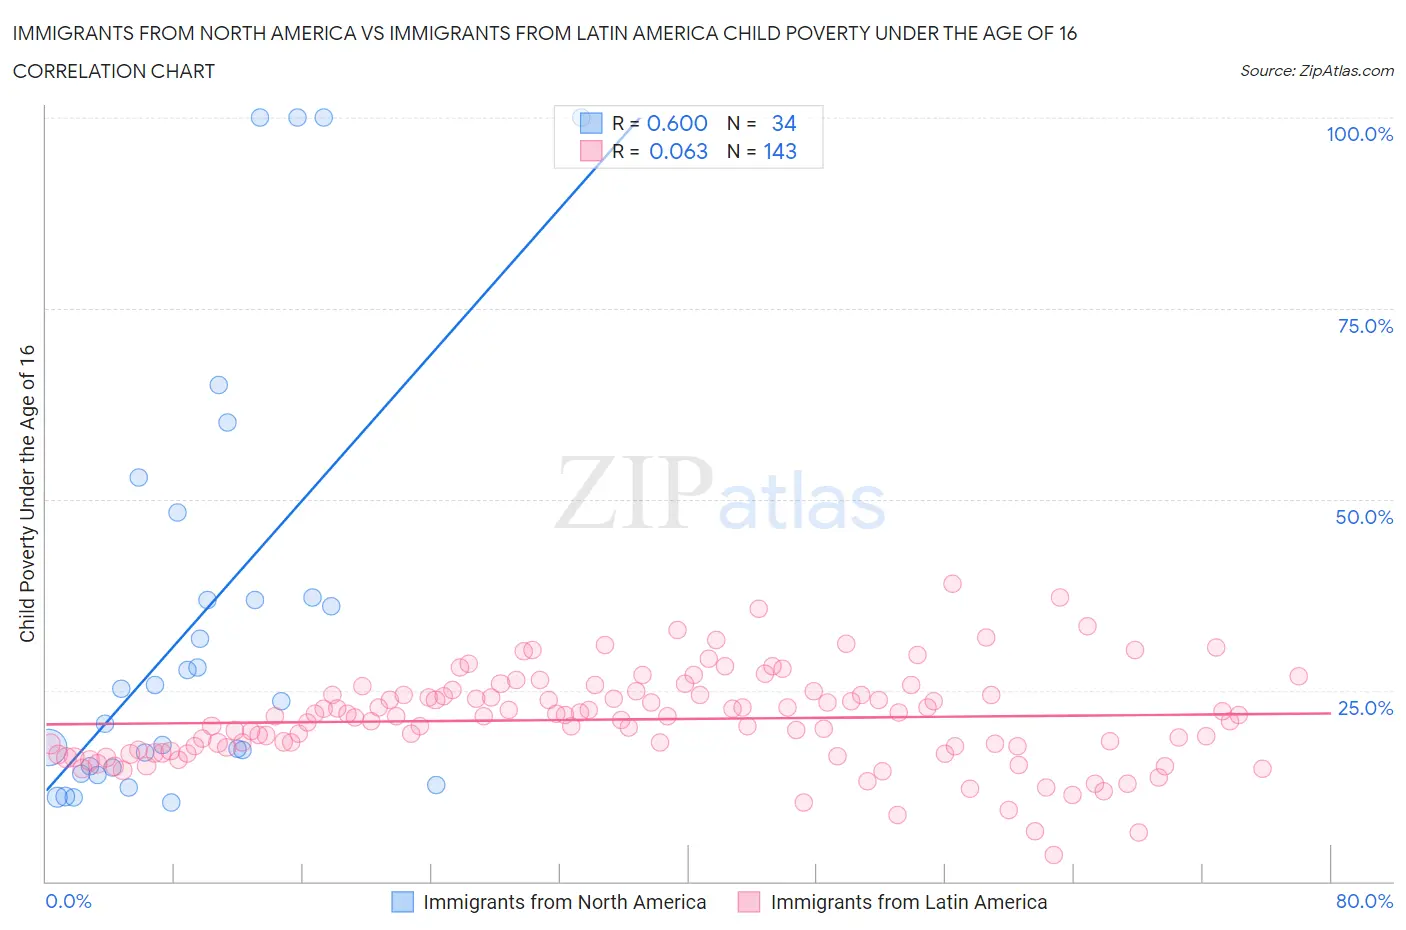
Immigrants from North America vs Immigrants from Latin America Child Poverty Under the Age of 16 Correlation Chart
The statistical analysis conducted on geographies consisting of 455,942,251 people shows a substantial positive correlation between the proportion of Immigrants from North America and poverty level among children under the age of 16 in the United States with a correlation coefficient (R) of 0.600 and weighted average of 14.6%. Similarly, the statistical analysis conducted on geographies consisting of 548,259,173 people shows a slight positive correlation between the proportion of Immigrants from Latin America and poverty level among children under the age of 16 in the United States with a correlation coefficient (R) of 0.063 and weighted average of 20.5%, a difference of 40.9%.
Child Poverty Under the Age of 16 Correlation Summary
| Measurement | Immigrants from North America | Immigrants from Latin America |
| Minimum | 10.3% | 3.5% |
| Maximum | 100.0% | 38.9% |
| Range | 89.7% | 35.4% |
| Mean | 34.4% | 21.2% |
| Median | 24.4% | 21.6% |
| Interquartile 25% (IQ1) | 14.9% | 17.0% |
| Interquartile 75% (IQ3) | 37.1% | 24.4% |
| Interquartile Range (IQR) | 22.2% | 7.4% |
| Standard Deviation (Sample) | 28.2% | 6.1% |
| Standard Deviation (Population) | 27.7% | 6.1% |
Similar Demographics by Child Poverty Under the Age of 16
Demographics Similar to Immigrants from North America by Child Poverty Under the Age of 16
In terms of child poverty under the age of 16, the demographic groups most similar to Immigrants from North America are Immigrants from Italy (14.6%, a difference of 0.030%), Argentinean (14.6%, a difference of 0.12%), Austrian (14.5%, a difference of 0.18%), German (14.5%, a difference of 0.25%), and Northern European (14.5%, a difference of 0.30%).
| Demographics | Rating | Rank | Child Poverty Under the Age of 16 |
| Immigrants | Latvia | 97.1 /100 | #84 | Exceptional 14.5% |
| Soviet Union | 97.1 /100 | #85 | Exceptional 14.5% |
| Immigrants | Argentina | 97.1 /100 | #86 | Exceptional 14.5% |
| Taiwanese | 97.1 /100 | #87 | Exceptional 14.5% |
| Northern Europeans | 97.0 /100 | #88 | Exceptional 14.5% |
| Germans | 96.9 /100 | #89 | Exceptional 14.5% |
| Austrians | 96.9 /100 | #90 | Exceptional 14.5% |
| Immigrants | North America | 96.7 /100 | #91 | Exceptional 14.6% |
| Immigrants | Italy | 96.7 /100 | #92 | Exceptional 14.6% |
| Argentineans | 96.6 /100 | #93 | Exceptional 14.6% |
| Immigrants | South Africa | 96.3 /100 | #94 | Exceptional 14.6% |
| Immigrants | Croatia | 96.1 /100 | #95 | Exceptional 14.6% |
| Immigrants | France | 95.8 /100 | #96 | Exceptional 14.7% |
| Paraguayans | 95.7 /100 | #97 | Exceptional 14.7% |
| Immigrants | Belarus | 95.7 /100 | #98 | Exceptional 14.7% |
Demographics Similar to Immigrants from Latin America by Child Poverty Under the Age of 16
In terms of child poverty under the age of 16, the demographic groups most similar to Immigrants from Latin America are Chippewa (20.5%, a difference of 0.040%), Immigrants from Senegal (20.6%, a difference of 0.43%), Haitian (20.7%, a difference of 0.64%), Mexican (20.7%, a difference of 0.77%), and Yaqui (20.4%, a difference of 0.79%).
| Demographics | Rating | Rank | Child Poverty Under the Age of 16 |
| Immigrants | St. Vincent and the Grenadines | 0.0 /100 | #285 | Tragic 20.1% |
| Immigrants | West Indies | 0.0 /100 | #286 | Tragic 20.2% |
| Blackfeet | 0.0 /100 | #287 | Tragic 20.2% |
| Immigrants | Belize | 0.0 /100 | #288 | Tragic 20.3% |
| Senegalese | 0.0 /100 | #289 | Tragic 20.4% |
| Yaqui | 0.0 /100 | #290 | Tragic 20.4% |
| Chippewa | 0.0 /100 | #291 | Tragic 20.5% |
| Immigrants | Latin America | 0.0 /100 | #292 | Tragic 20.5% |
| Immigrants | Senegal | 0.0 /100 | #293 | Tragic 20.6% |
| Haitians | 0.0 /100 | #294 | Tragic 20.7% |
| Mexicans | 0.0 /100 | #295 | Tragic 20.7% |
| Immigrants | Caribbean | 0.0 /100 | #296 | Tragic 20.8% |
| Hispanics or Latinos | 0.0 /100 | #297 | Tragic 20.8% |
| Arapaho | 0.0 /100 | #298 | Tragic 20.8% |
| Immigrants | Haiti | 0.0 /100 | #299 | Tragic 20.9% |