Immigrants from Nigeria vs Lumbee College, 1 year or more
COMPARE
Immigrants from Nigeria
Lumbee
College, 1 year or more
College, 1 year or more Comparison
Immigrants from Nigeria
Lumbee
57.9%
COLLEGE, 1 YEAR OR MORE
13.3/ 100
METRIC RATING
211th/ 347
METRIC RANK
48.9%
COLLEGE, 1 YEAR OR MORE
0.0/ 100
METRIC RATING
334th/ 347
METRIC RANK
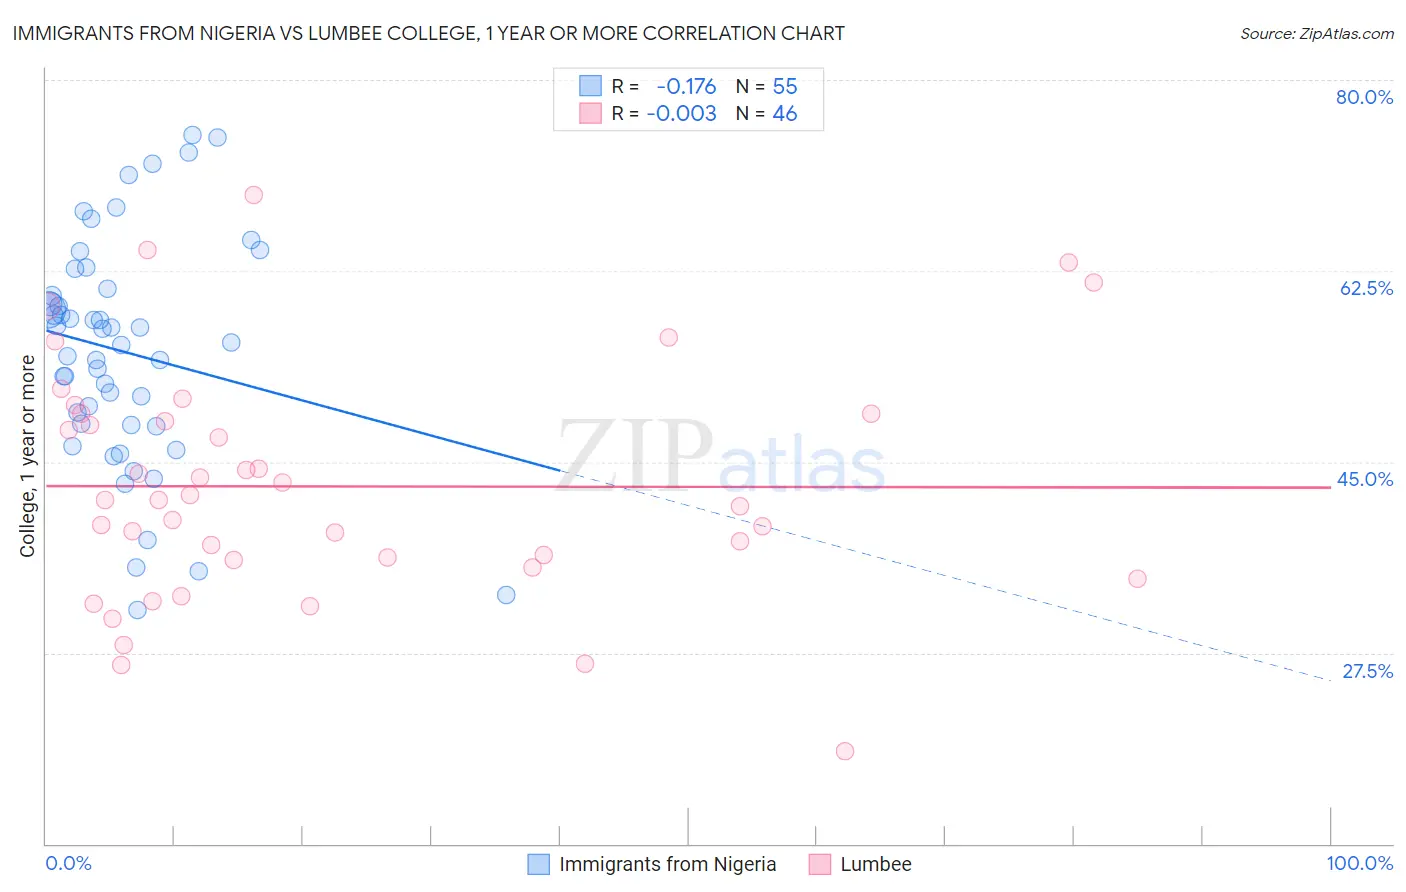
Immigrants from Nigeria vs Lumbee College, 1 year or more Correlation Chart
The statistical analysis conducted on geographies consisting of 283,490,343 people shows a poor negative correlation between the proportion of Immigrants from Nigeria and percentage of population with at least college, 1 year or more education in the United States with a correlation coefficient (R) of -0.176 and weighted average of 57.9%. Similarly, the statistical analysis conducted on geographies consisting of 92,299,068 people shows no correlation between the proportion of Lumbee and percentage of population with at least college, 1 year or more education in the United States with a correlation coefficient (R) of -0.003 and weighted average of 48.9%, a difference of 18.6%.
College, 1 year or more Correlation Summary
| Measurement | Immigrants from Nigeria | Lumbee |
| Minimum | 31.4% | 18.5% |
| Maximum | 75.0% | 69.5% |
| Range | 43.6% | 51.0% |
| Mean | 55.1% | 42.8% |
| Median | 55.9% | 41.5% |
| Interquartile 25% (IQ1) | 48.4% | 36.0% |
| Interquartile 75% (IQ3) | 60.9% | 49.4% |
| Interquartile Range (IQR) | 12.5% | 13.4% |
| Standard Deviation (Sample) | 10.4% | 10.9% |
| Standard Deviation (Population) | 10.3% | 10.8% |
Similar Demographics by College, 1 year or more
Demographics Similar to Immigrants from Nigeria by College, 1 year or more
In terms of college, 1 year or more, the demographic groups most similar to Immigrants from Nigeria are Tsimshian (57.9%, a difference of 0.020%), Immigrants from Middle Africa (58.0%, a difference of 0.080%), Immigrants from Senegal (57.8%, a difference of 0.18%), French Canadian (57.8%, a difference of 0.18%), and Immigrants from Colombia (57.8%, a difference of 0.21%).
| Demographics | Rating | Rank | College, 1 year or more |
| Panamanians | 19.2 /100 | #204 | Poor 58.3% |
| Immigrants | Zaire | 18.7 /100 | #205 | Poor 58.3% |
| Immigrants | Vietnam | 18.2 /100 | #206 | Poor 58.2% |
| Senegalese | 16.9 /100 | #207 | Poor 58.2% |
| Immigrants | Uruguay | 15.2 /100 | #208 | Poor 58.1% |
| Immigrants | Middle Africa | 14.0 /100 | #209 | Poor 58.0% |
| Tsimshian | 13.5 /100 | #210 | Poor 57.9% |
| Immigrants | Nigeria | 13.3 /100 | #211 | Poor 57.9% |
| Immigrants | Senegal | 11.8 /100 | #212 | Poor 57.8% |
| French Canadians | 11.8 /100 | #213 | Poor 57.8% |
| Immigrants | Colombia | 11.6 /100 | #214 | Poor 57.8% |
| Tongans | 11.6 /100 | #215 | Poor 57.8% |
| Immigrants | Peru | 10.6 /100 | #216 | Poor 57.7% |
| Immigrants | Panama | 9.1 /100 | #217 | Tragic 57.6% |
| Native Hawaiians | 9.0 /100 | #218 | Tragic 57.6% |
Demographics Similar to Lumbee by College, 1 year or more
In terms of college, 1 year or more, the demographic groups most similar to Lumbee are Yuman (48.7%, a difference of 0.28%), Immigrants from Dominican Republic (49.1%, a difference of 0.58%), Spanish American Indian (48.5%, a difference of 0.72%), Pennsylvania German (48.5%, a difference of 0.73%), and Mexican (49.2%, a difference of 0.75%).
| Demographics | Rating | Rank | College, 1 year or more |
| Menominee | 0.0 /100 | #327 | Tragic 50.6% |
| Dutch West Indians | 0.0 /100 | #328 | Tragic 50.5% |
| Cape Verdeans | 0.0 /100 | #329 | Tragic 50.3% |
| Natives/Alaskans | 0.0 /100 | #330 | Tragic 50.2% |
| Immigrants | Yemen | 0.0 /100 | #331 | Tragic 50.0% |
| Mexicans | 0.0 /100 | #332 | Tragic 49.2% |
| Immigrants | Dominican Republic | 0.0 /100 | #333 | Tragic 49.1% |
| Lumbee | 0.0 /100 | #334 | Tragic 48.9% |
| Yuman | 0.0 /100 | #335 | Tragic 48.7% |
| Spanish American Indians | 0.0 /100 | #336 | Tragic 48.5% |
| Pennsylvania Germans | 0.0 /100 | #337 | Tragic 48.5% |
| Immigrants | Central America | 0.0 /100 | #338 | Tragic 48.5% |
| Immigrants | Azores | 0.0 /100 | #339 | Tragic 48.4% |
| Immigrants | Cabo Verde | 0.0 /100 | #340 | Tragic 48.1% |
| Immigrants | Mexico | 0.0 /100 | #341 | Tragic 47.5% |