Immigrants from Nigeria vs Immigrants from Cameroon College, 1 year or more
COMPARE
Immigrants from Nigeria
Immigrants from Cameroon
College, 1 year or more
College, 1 year or more Comparison
Immigrants from Nigeria
Immigrants from Cameroon
57.9%
COLLEGE, 1 YEAR OR MORE
13.3/ 100
METRIC RATING
211th/ 347
METRIC RANK
58.8%
COLLEGE, 1 YEAR OR MORE
31.2/ 100
METRIC RATING
190th/ 347
METRIC RANK
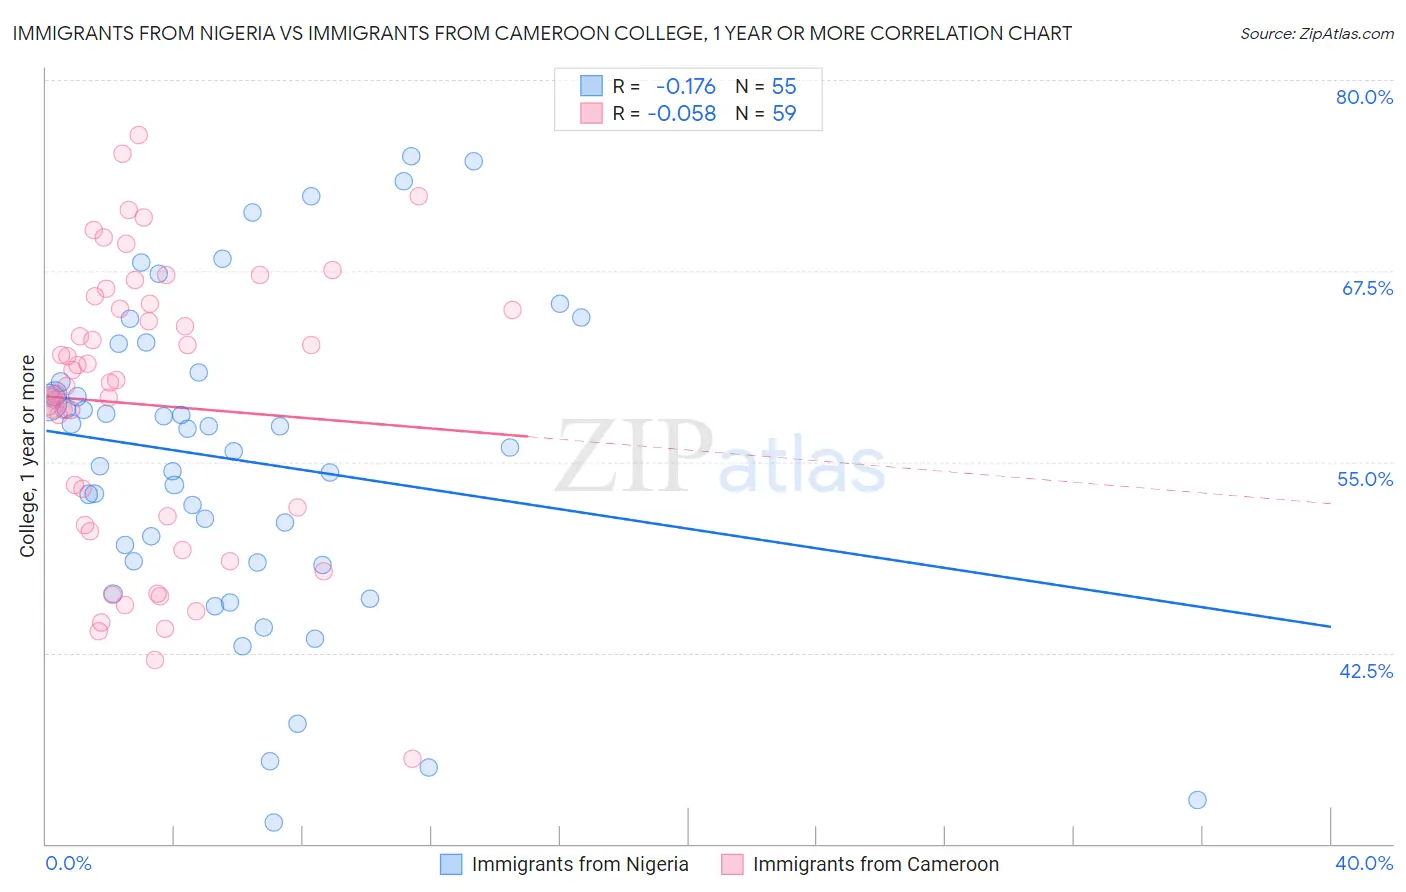
Immigrants from Nigeria vs Immigrants from Cameroon College, 1 year or more Correlation Chart
The statistical analysis conducted on geographies consisting of 283,490,343 people shows a poor negative correlation between the proportion of Immigrants from Nigeria and percentage of population with at least college, 1 year or more education in the United States with a correlation coefficient (R) of -0.176 and weighted average of 57.9%. Similarly, the statistical analysis conducted on geographies consisting of 130,767,721 people shows a slight negative correlation between the proportion of Immigrants from Cameroon and percentage of population with at least college, 1 year or more education in the United States with a correlation coefficient (R) of -0.058 and weighted average of 58.8%, a difference of 1.5%.
College, 1 year or more Correlation Summary
| Measurement | Immigrants from Nigeria | Immigrants from Cameroon |
| Minimum | 31.4% | 35.5% |
| Maximum | 75.0% | 76.4% |
| Range | 43.6% | 40.9% |
| Mean | 55.1% | 58.7% |
| Median | 55.9% | 60.2% |
| Interquartile 25% (IQ1) | 48.4% | 50.9% |
| Interquartile 75% (IQ3) | 60.9% | 65.4% |
| Interquartile Range (IQR) | 12.5% | 14.5% |
| Standard Deviation (Sample) | 10.4% | 9.3% |
| Standard Deviation (Population) | 10.3% | 9.2% |
Similar Demographics by College, 1 year or more
Demographics Similar to Immigrants from Nigeria by College, 1 year or more
In terms of college, 1 year or more, the demographic groups most similar to Immigrants from Nigeria are Tsimshian (57.9%, a difference of 0.020%), Immigrants from Middle Africa (58.0%, a difference of 0.080%), Immigrants from Senegal (57.8%, a difference of 0.18%), French Canadian (57.8%, a difference of 0.18%), and Immigrants from Colombia (57.8%, a difference of 0.21%).
| Demographics | Rating | Rank | College, 1 year or more |
| Panamanians | 19.2 /100 | #204 | Poor 58.3% |
| Immigrants | Zaire | 18.7 /100 | #205 | Poor 58.3% |
| Immigrants | Vietnam | 18.2 /100 | #206 | Poor 58.2% |
| Senegalese | 16.9 /100 | #207 | Poor 58.2% |
| Immigrants | Uruguay | 15.2 /100 | #208 | Poor 58.1% |
| Immigrants | Middle Africa | 14.0 /100 | #209 | Poor 58.0% |
| Tsimshian | 13.5 /100 | #210 | Poor 57.9% |
| Immigrants | Nigeria | 13.3 /100 | #211 | Poor 57.9% |
| Immigrants | Senegal | 11.8 /100 | #212 | Poor 57.8% |
| French Canadians | 11.8 /100 | #213 | Poor 57.8% |
| Immigrants | Colombia | 11.6 /100 | #214 | Poor 57.8% |
| Tongans | 11.6 /100 | #215 | Poor 57.8% |
| Immigrants | Peru | 10.6 /100 | #216 | Poor 57.7% |
| Immigrants | Panama | 9.1 /100 | #217 | Tragic 57.6% |
| Native Hawaiians | 9.0 /100 | #218 | Tragic 57.6% |
Demographics Similar to Immigrants from Cameroon by College, 1 year or more
In terms of college, 1 year or more, the demographic groups most similar to Immigrants from Cameroon are Uruguayan (58.8%, a difference of 0.040%), Immigrants from Philippines (58.7%, a difference of 0.13%), French (58.9%, a difference of 0.19%), Scotch-Irish (58.9%, a difference of 0.21%), and German (58.9%, a difference of 0.21%).
| Demographics | Rating | Rank | College, 1 year or more |
| German Russians | 39.3 /100 | #183 | Fair 59.1% |
| Spaniards | 38.3 /100 | #184 | Fair 59.0% |
| South Americans | 35.9 /100 | #185 | Fair 59.0% |
| Scotch-Irish | 34.7 /100 | #186 | Fair 58.9% |
| Germans | 34.7 /100 | #187 | Fair 58.9% |
| French | 34.4 /100 | #188 | Fair 58.9% |
| Uruguayans | 31.8 /100 | #189 | Fair 58.8% |
| Immigrants | Cameroon | 31.2 /100 | #190 | Fair 58.8% |
| Immigrants | Philippines | 29.2 /100 | #191 | Fair 58.7% |
| Colombians | 27.6 /100 | #192 | Fair 58.7% |
| Peruvians | 27.5 /100 | #193 | Fair 58.6% |
| Costa Ricans | 26.4 /100 | #194 | Fair 58.6% |
| Dutch | 26.2 /100 | #195 | Fair 58.6% |
| Guamanians/Chamorros | 26.2 /100 | #196 | Fair 58.6% |
| Immigrants | Thailand | 26.0 /100 | #197 | Fair 58.6% |