Immigrants from Nigeria vs Immigrants from Norway College, 1 year or more
COMPARE
Immigrants from Nigeria
Immigrants from Norway
College, 1 year or more
College, 1 year or more Comparison
Immigrants from Nigeria
Immigrants from Norway
57.9%
COLLEGE, 1 YEAR OR MORE
13.3/ 100
METRIC RATING
211th/ 347
METRIC RANK
64.7%
COLLEGE, 1 YEAR OR MORE
99.9/ 100
METRIC RATING
44th/ 347
METRIC RANK
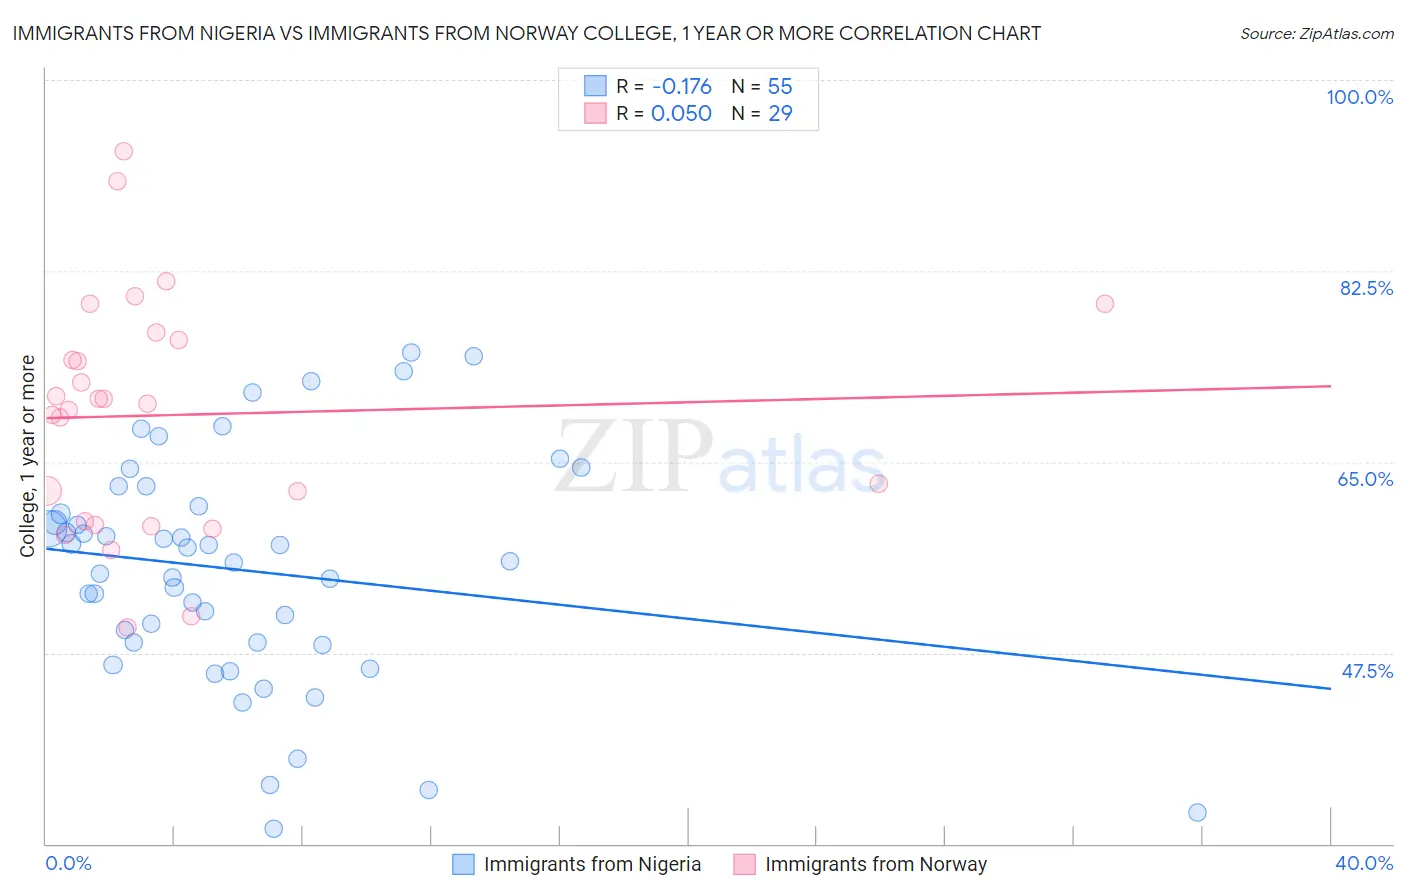
Immigrants from Nigeria vs Immigrants from Norway College, 1 year or more Correlation Chart
The statistical analysis conducted on geographies consisting of 283,490,343 people shows a poor negative correlation between the proportion of Immigrants from Nigeria and percentage of population with at least college, 1 year or more education in the United States with a correlation coefficient (R) of -0.176 and weighted average of 57.9%. Similarly, the statistical analysis conducted on geographies consisting of 116,716,420 people shows no correlation between the proportion of Immigrants from Norway and percentage of population with at least college, 1 year or more education in the United States with a correlation coefficient (R) of 0.050 and weighted average of 64.7%, a difference of 11.7%.
College, 1 year or more Correlation Summary
| Measurement | Immigrants from Nigeria | Immigrants from Norway |
| Minimum | 31.4% | 49.9% |
| Maximum | 75.0% | 93.5% |
| Range | 43.6% | 43.6% |
| Mean | 55.1% | 69.3% |
| Median | 55.9% | 70.3% |
| Interquartile 25% (IQ1) | 48.4% | 59.4% |
| Interquartile 75% (IQ3) | 60.9% | 76.5% |
| Interquartile Range (IQR) | 12.5% | 17.1% |
| Standard Deviation (Sample) | 10.4% | 10.7% |
| Standard Deviation (Population) | 10.3% | 10.6% |
Similar Demographics by College, 1 year or more
Demographics Similar to Immigrants from Nigeria by College, 1 year or more
In terms of college, 1 year or more, the demographic groups most similar to Immigrants from Nigeria are Tsimshian (57.9%, a difference of 0.020%), Immigrants from Middle Africa (58.0%, a difference of 0.080%), Immigrants from Senegal (57.8%, a difference of 0.18%), French Canadian (57.8%, a difference of 0.18%), and Immigrants from Colombia (57.8%, a difference of 0.21%).
| Demographics | Rating | Rank | College, 1 year or more |
| Panamanians | 19.2 /100 | #204 | Poor 58.3% |
| Immigrants | Zaire | 18.7 /100 | #205 | Poor 58.3% |
| Immigrants | Vietnam | 18.2 /100 | #206 | Poor 58.2% |
| Senegalese | 16.9 /100 | #207 | Poor 58.2% |
| Immigrants | Uruguay | 15.2 /100 | #208 | Poor 58.1% |
| Immigrants | Middle Africa | 14.0 /100 | #209 | Poor 58.0% |
| Tsimshian | 13.5 /100 | #210 | Poor 57.9% |
| Immigrants | Nigeria | 13.3 /100 | #211 | Poor 57.9% |
| Immigrants | Senegal | 11.8 /100 | #212 | Poor 57.8% |
| French Canadians | 11.8 /100 | #213 | Poor 57.8% |
| Immigrants | Colombia | 11.6 /100 | #214 | Poor 57.8% |
| Tongans | 11.6 /100 | #215 | Poor 57.8% |
| Immigrants | Peru | 10.6 /100 | #216 | Poor 57.7% |
| Immigrants | Panama | 9.1 /100 | #217 | Tragic 57.6% |
| Native Hawaiians | 9.0 /100 | #218 | Tragic 57.6% |
Demographics Similar to Immigrants from Norway by College, 1 year or more
In terms of college, 1 year or more, the demographic groups most similar to Immigrants from Norway are Immigrants from Russia (64.7%, a difference of 0.020%), Immigrants from Latvia (64.8%, a difference of 0.14%), Mongolian (64.8%, a difference of 0.15%), Immigrants from Lithuania (64.6%, a difference of 0.17%), and Bhutanese (64.6%, a difference of 0.18%).
| Demographics | Rating | Rank | College, 1 year or more |
| Russians | 99.9 /100 | #37 | Exceptional 65.1% |
| Immigrants | Saudi Arabia | 99.9 /100 | #38 | Exceptional 65.0% |
| Estonians | 99.9 /100 | #39 | Exceptional 65.0% |
| Immigrants | Kuwait | 99.9 /100 | #40 | Exceptional 65.0% |
| Mongolians | 99.9 /100 | #41 | Exceptional 64.8% |
| Immigrants | Latvia | 99.9 /100 | #42 | Exceptional 64.8% |
| Immigrants | Russia | 99.9 /100 | #43 | Exceptional 64.7% |
| Immigrants | Norway | 99.9 /100 | #44 | Exceptional 64.7% |
| Immigrants | Lithuania | 99.9 /100 | #45 | Exceptional 64.6% |
| Bhutanese | 99.9 /100 | #46 | Exceptional 64.6% |
| Australians | 99.9 /100 | #47 | Exceptional 64.6% |
| Immigrants | Bulgaria | 99.9 /100 | #48 | Exceptional 64.6% |
| New Zealanders | 99.9 /100 | #49 | Exceptional 64.6% |
| Immigrants | Austria | 99.8 /100 | #50 | Exceptional 64.4% |
| Immigrants | Malaysia | 99.8 /100 | #51 | Exceptional 64.3% |