Immigrants from Nigeria vs Immigrants from Norway Median Male Earnings
COMPARE
Immigrants from Nigeria
Immigrants from Norway
Median Male Earnings
Median Male Earnings Comparison
Immigrants from Nigeria
Immigrants from Norway
$51,310
MEDIAN MALE EARNINGS
4.2/ 100
METRIC RATING
230th/ 347
METRIC RANK
$61,628
MEDIAN MALE EARNINGS
99.9/ 100
METRIC RATING
52nd/ 347
METRIC RANK
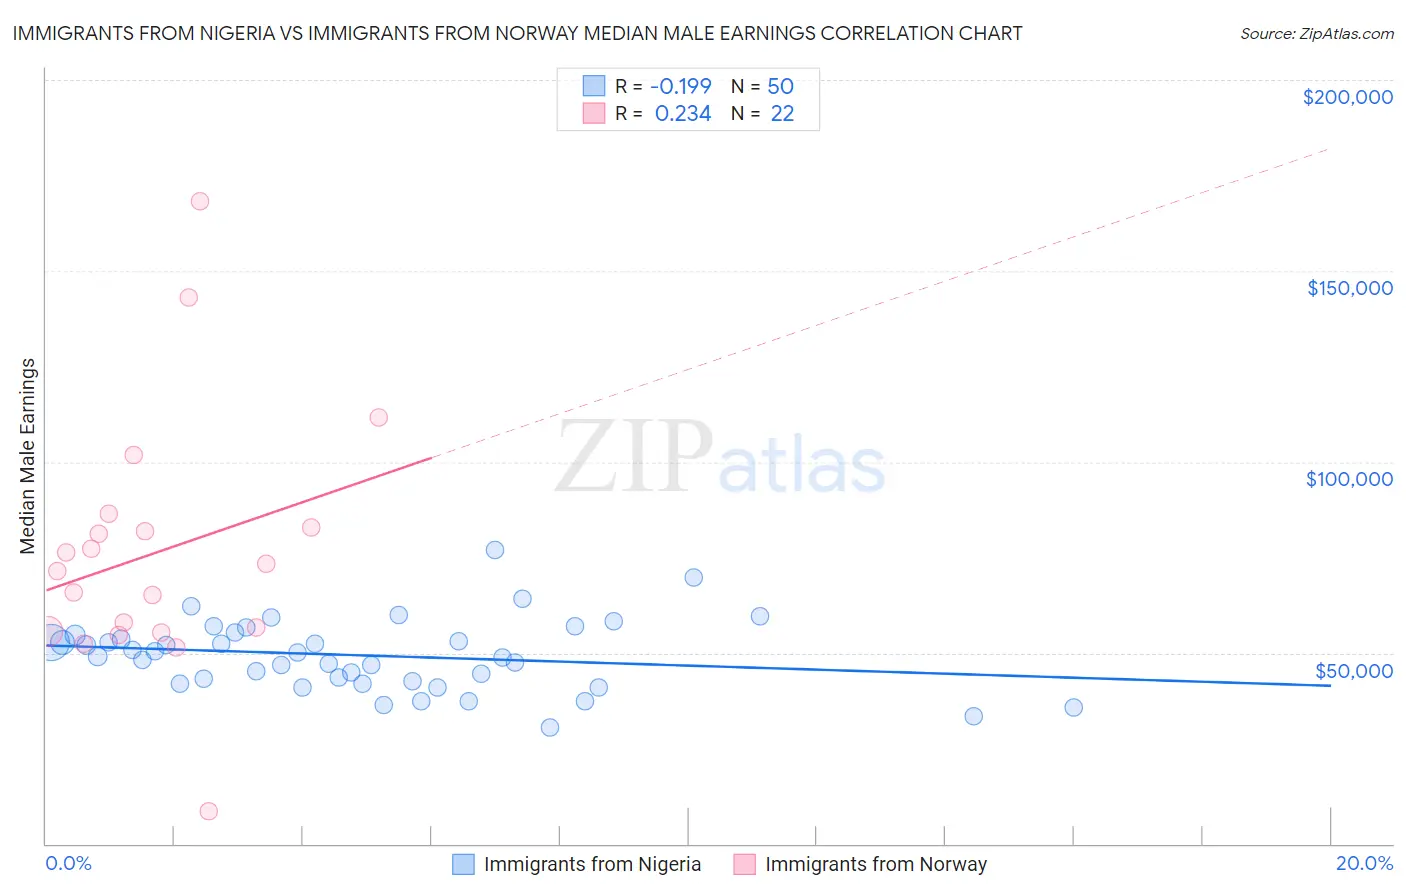
Immigrants from Nigeria vs Immigrants from Norway Median Male Earnings Correlation Chart
The statistical analysis conducted on geographies consisting of 283,479,076 people shows a poor negative correlation between the proportion of Immigrants from Nigeria and median male earnings in the United States with a correlation coefficient (R) of -0.199 and weighted average of $51,310. Similarly, the statistical analysis conducted on geographies consisting of 116,702,945 people shows a weak positive correlation between the proportion of Immigrants from Norway and median male earnings in the United States with a correlation coefficient (R) of 0.234 and weighted average of $61,628, a difference of 20.1%.
Median Male Earnings Correlation Summary
| Measurement | Immigrants from Nigeria | Immigrants from Norway |
| Minimum | $30,472 | $8,547 |
| Maximum | $76,820 | $168,268 |
| Range | $46,348 | $159,721 |
| Mean | $49,348 | $76,311 |
| Median | $49,638 | $72,426 |
| Interquartile 25% (IQ1) | $42,561 | $55,593 |
| Interquartile 75% (IQ3) | $54,633 | $82,963 |
| Interquartile Range (IQR) | $12,072 | $27,370 |
| Standard Deviation (Sample) | $9,267 | $33,202 |
| Standard Deviation (Population) | $9,173 | $32,439 |
Similar Demographics by Median Male Earnings
Demographics Similar to Immigrants from Nigeria by Median Male Earnings
In terms of median male earnings, the demographic groups most similar to Immigrants from Nigeria are Immigrants from Trinidad and Tobago ($51,376, a difference of 0.13%), Barbadian ($51,236, a difference of 0.14%), Samoan ($51,389, a difference of 0.16%), Sudanese ($51,216, a difference of 0.18%), and Trinidadian and Tobagonian ($51,446, a difference of 0.27%).
| Demographics | Rating | Rank | Median Male Earnings |
| Ecuadorians | 5.5 /100 | #223 | Tragic $51,596 |
| Immigrants | Cambodia | 5.5 /100 | #224 | Tragic $51,594 |
| Immigrants | Sudan | 5.0 /100 | #225 | Tragic $51,489 |
| Japanese | 4.9 /100 | #226 | Tragic $51,473 |
| Trinidadians and Tobagonians | 4.8 /100 | #227 | Tragic $51,446 |
| Samoans | 4.6 /100 | #228 | Tragic $51,389 |
| Immigrants | Trinidad and Tobago | 4.5 /100 | #229 | Tragic $51,376 |
| Immigrants | Nigeria | 4.2 /100 | #230 | Tragic $51,310 |
| Barbadians | 3.9 /100 | #231 | Tragic $51,236 |
| Sudanese | 3.9 /100 | #232 | Tragic $51,216 |
| Aleuts | 3.7 /100 | #233 | Tragic $51,168 |
| Cape Verdeans | 3.5 /100 | #234 | Tragic $51,103 |
| Immigrants | Western Africa | 3.0 /100 | #235 | Tragic $50,940 |
| Pennsylvania Germans | 2.8 /100 | #236 | Tragic $50,878 |
| Immigrants | Barbados | 2.6 /100 | #237 | Tragic $50,795 |
Demographics Similar to Immigrants from Norway by Median Male Earnings
In terms of median male earnings, the demographic groups most similar to Immigrants from Norway are Estonian ($61,710, a difference of 0.13%), Bhutanese ($61,759, a difference of 0.21%), South African ($61,460, a difference of 0.27%), Immigrants from Latvia ($61,422, a difference of 0.34%), and Greek ($61,242, a difference of 0.63%).
| Demographics | Rating | Rank | Median Male Earnings |
| Bulgarians | 100.0 /100 | #45 | Exceptional $62,378 |
| Immigrants | Czechoslovakia | 99.9 /100 | #46 | Exceptional $62,217 |
| Immigrants | Austria | 99.9 /100 | #47 | Exceptional $62,164 |
| Immigrants | Malaysia | 99.9 /100 | #48 | Exceptional $62,121 |
| Immigrants | Europe | 99.9 /100 | #49 | Exceptional $62,057 |
| Bhutanese | 99.9 /100 | #50 | Exceptional $61,759 |
| Estonians | 99.9 /100 | #51 | Exceptional $61,710 |
| Immigrants | Norway | 99.9 /100 | #52 | Exceptional $61,628 |
| South Africans | 99.9 /100 | #53 | Exceptional $61,460 |
| Immigrants | Latvia | 99.9 /100 | #54 | Exceptional $61,422 |
| Greeks | 99.9 /100 | #55 | Exceptional $61,242 |
| Lithuanians | 99.9 /100 | #56 | Exceptional $61,228 |
| Immigrants | Scotland | 99.9 /100 | #57 | Exceptional $61,220 |
| New Zealanders | 99.9 /100 | #58 | Exceptional $61,199 |
| Immigrants | Netherlands | 99.8 /100 | #59 | Exceptional $61,096 |