Iranian vs Immigrants from Norway College, 1 year or more
COMPARE
Iranian
Immigrants from Norway
College, 1 year or more
College, 1 year or more Comparison
Iranians
Immigrants from Norway
70.0%
COLLEGE, 1 YEAR OR MORE
100.0/ 100
METRIC RATING
3rd/ 347
METRIC RANK
64.7%
COLLEGE, 1 YEAR OR MORE
99.9/ 100
METRIC RATING
44th/ 347
METRIC RANK
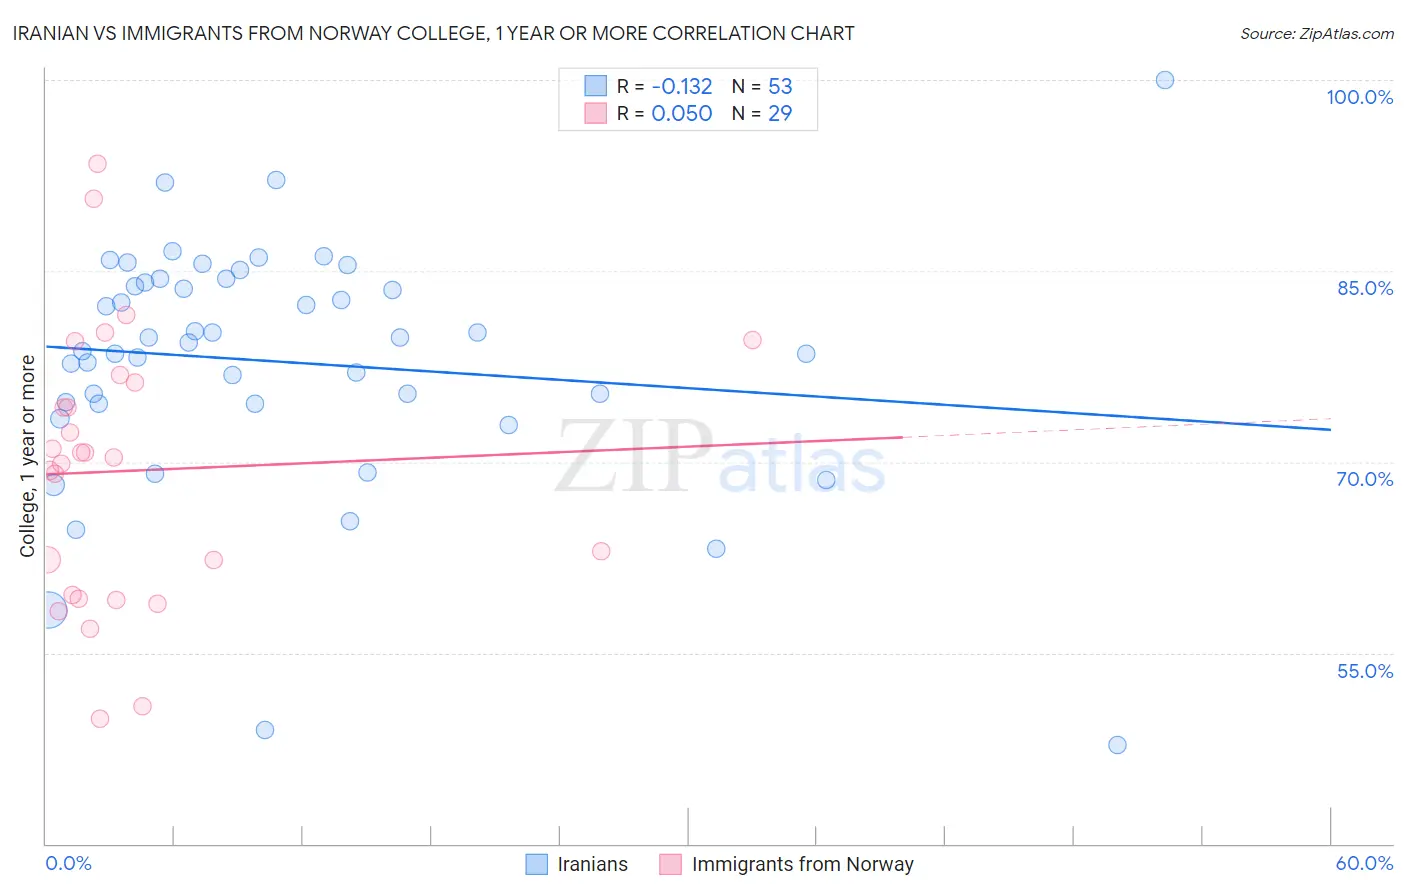
Iranian vs Immigrants from Norway College, 1 year or more Correlation Chart
The statistical analysis conducted on geographies consisting of 316,900,663 people shows a poor negative correlation between the proportion of Iranians and percentage of population with at least college, 1 year or more education in the United States with a correlation coefficient (R) of -0.132 and weighted average of 70.0%. Similarly, the statistical analysis conducted on geographies consisting of 116,716,420 people shows no correlation between the proportion of Immigrants from Norway and percentage of population with at least college, 1 year or more education in the United States with a correlation coefficient (R) of 0.050 and weighted average of 64.7%, a difference of 8.1%.
College, 1 year or more Correlation Summary
| Measurement | Iranian | Immigrants from Norway |
| Minimum | 47.7% | 49.9% |
| Maximum | 100.0% | 93.5% |
| Range | 52.3% | 43.6% |
| Mean | 77.8% | 69.3% |
| Median | 79.4% | 70.3% |
| Interquartile 25% (IQ1) | 74.6% | 59.4% |
| Interquartile 75% (IQ3) | 84.2% | 76.5% |
| Interquartile Range (IQR) | 9.7% | 17.1% |
| Standard Deviation (Sample) | 9.6% | 10.7% |
| Standard Deviation (Population) | 9.6% | 10.6% |
Similar Demographics by College, 1 year or more
Demographics Similar to Iranians by College, 1 year or more
In terms of college, 1 year or more, the demographic groups most similar to Iranians are Immigrants from Singapore (70.1%, a difference of 0.22%), Immigrants from Taiwan (69.6%, a difference of 0.49%), Immigrants from India (69.6%, a difference of 0.49%), Immigrants from Iran (69.5%, a difference of 0.70%), and Filipino (71.0%, a difference of 1.4%).
| Demographics | Rating | Rank | College, 1 year or more |
| Filipinos | 100.0 /100 | #1 | Exceptional 71.0% |
| Immigrants | Singapore | 100.0 /100 | #2 | Exceptional 70.1% |
| Iranians | 100.0 /100 | #3 | Exceptional 70.0% |
| Immigrants | Taiwan | 100.0 /100 | #4 | Exceptional 69.6% |
| Immigrants | India | 100.0 /100 | #5 | Exceptional 69.6% |
| Immigrants | Iran | 100.0 /100 | #6 | Exceptional 69.5% |
| Okinawans | 100.0 /100 | #7 | Exceptional 69.0% |
| Thais | 100.0 /100 | #8 | Exceptional 68.6% |
| Immigrants | Israel | 100.0 /100 | #9 | Exceptional 67.8% |
| Immigrants | Australia | 100.0 /100 | #10 | Exceptional 67.7% |
| Immigrants | South Central Asia | 100.0 /100 | #11 | Exceptional 67.1% |
| Cypriots | 100.0 /100 | #12 | Exceptional 67.0% |
| Immigrants | Sweden | 100.0 /100 | #13 | Exceptional 66.8% |
| Burmese | 100.0 /100 | #14 | Exceptional 66.7% |
| Cambodians | 100.0 /100 | #15 | Exceptional 66.7% |
Demographics Similar to Immigrants from Norway by College, 1 year or more
In terms of college, 1 year or more, the demographic groups most similar to Immigrants from Norway are Immigrants from Russia (64.7%, a difference of 0.020%), Immigrants from Latvia (64.8%, a difference of 0.14%), Mongolian (64.8%, a difference of 0.15%), Immigrants from Lithuania (64.6%, a difference of 0.17%), and Bhutanese (64.6%, a difference of 0.18%).
| Demographics | Rating | Rank | College, 1 year or more |
| Russians | 99.9 /100 | #37 | Exceptional 65.1% |
| Immigrants | Saudi Arabia | 99.9 /100 | #38 | Exceptional 65.0% |
| Estonians | 99.9 /100 | #39 | Exceptional 65.0% |
| Immigrants | Kuwait | 99.9 /100 | #40 | Exceptional 65.0% |
| Mongolians | 99.9 /100 | #41 | Exceptional 64.8% |
| Immigrants | Latvia | 99.9 /100 | #42 | Exceptional 64.8% |
| Immigrants | Russia | 99.9 /100 | #43 | Exceptional 64.7% |
| Immigrants | Norway | 99.9 /100 | #44 | Exceptional 64.7% |
| Immigrants | Lithuania | 99.9 /100 | #45 | Exceptional 64.6% |
| Bhutanese | 99.9 /100 | #46 | Exceptional 64.6% |
| Australians | 99.9 /100 | #47 | Exceptional 64.6% |
| Immigrants | Bulgaria | 99.9 /100 | #48 | Exceptional 64.6% |
| New Zealanders | 99.9 /100 | #49 | Exceptional 64.6% |
| Immigrants | Austria | 99.8 /100 | #50 | Exceptional 64.4% |
| Immigrants | Malaysia | 99.8 /100 | #51 | Exceptional 64.3% |