Spanish American Indian vs Immigrants from Norway College, 1 year or more
COMPARE
Spanish American Indian
Immigrants from Norway
College, 1 year or more
College, 1 year or more Comparison
Spanish American Indians
Immigrants from Norway
48.5%
COLLEGE, 1 YEAR OR MORE
0.0/ 100
METRIC RATING
336th/ 347
METRIC RANK
64.7%
COLLEGE, 1 YEAR OR MORE
99.9/ 100
METRIC RATING
44th/ 347
METRIC RANK
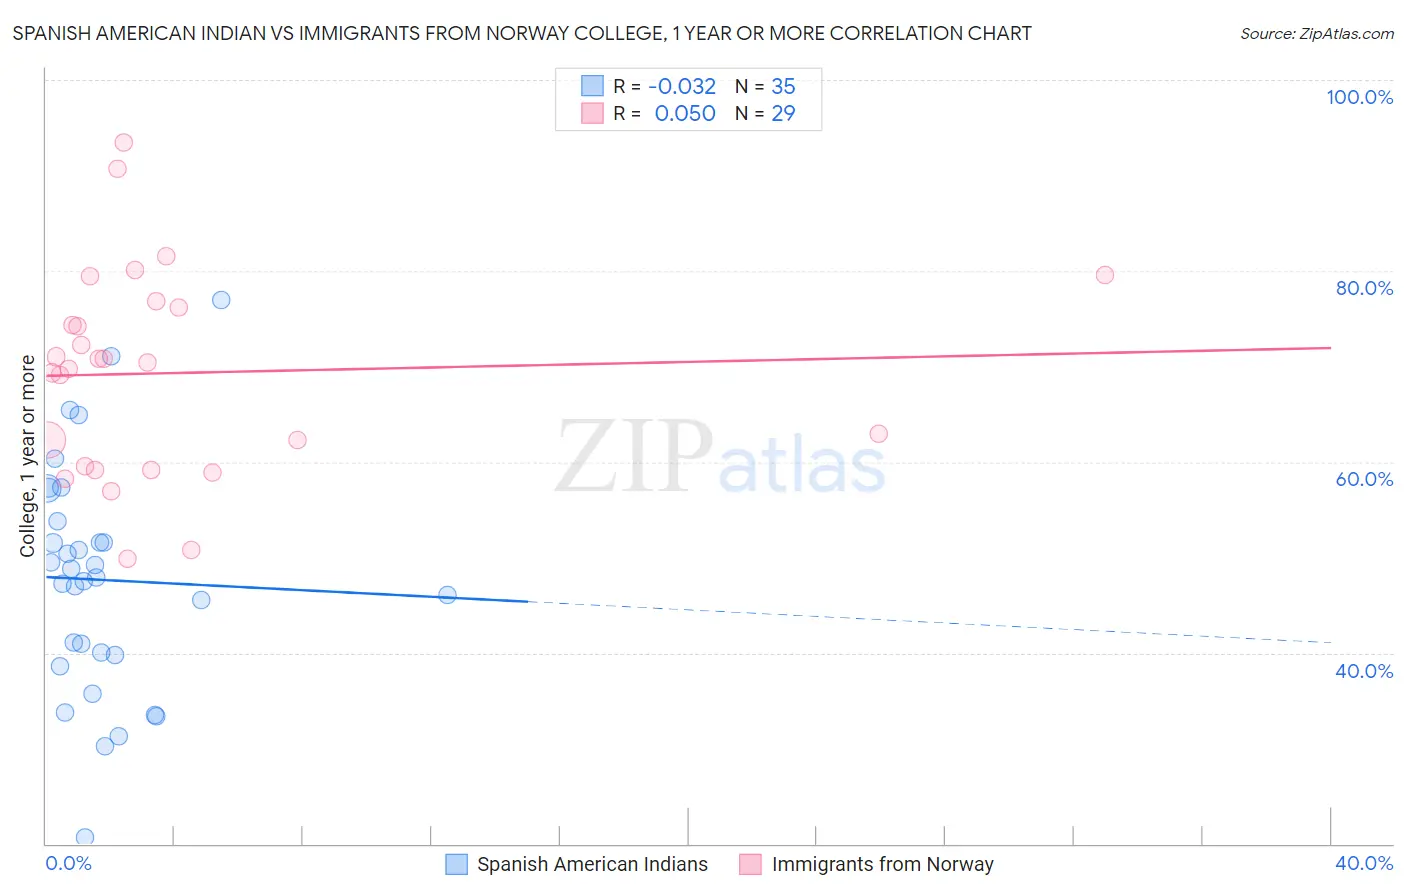
Spanish American Indian vs Immigrants from Norway College, 1 year or more Correlation Chart
The statistical analysis conducted on geographies consisting of 73,150,359 people shows no correlation between the proportion of Spanish American Indians and percentage of population with at least college, 1 year or more education in the United States with a correlation coefficient (R) of -0.032 and weighted average of 48.5%. Similarly, the statistical analysis conducted on geographies consisting of 116,716,420 people shows no correlation between the proportion of Immigrants from Norway and percentage of population with at least college, 1 year or more education in the United States with a correlation coefficient (R) of 0.050 and weighted average of 64.7%, a difference of 33.4%.
College, 1 year or more Correlation Summary
| Measurement | Spanish American Indian | Immigrants from Norway |
| Minimum | 20.6% | 49.9% |
| Maximum | 77.0% | 93.5% |
| Range | 56.4% | 43.6% |
| Mean | 47.6% | 69.3% |
| Median | 47.8% | 70.3% |
| Interquartile 25% (IQ1) | 39.7% | 59.4% |
| Interquartile 75% (IQ3) | 53.8% | 76.5% |
| Interquartile Range (IQR) | 14.1% | 17.1% |
| Standard Deviation (Sample) | 12.0% | 10.7% |
| Standard Deviation (Population) | 11.8% | 10.6% |
Similar Demographics by College, 1 year or more
Demographics Similar to Spanish American Indians by College, 1 year or more
In terms of college, 1 year or more, the demographic groups most similar to Spanish American Indians are Pennsylvania German (48.5%, a difference of 0.010%), Immigrants from Central America (48.5%, a difference of 0.060%), Immigrants from the Azores (48.4%, a difference of 0.32%), Yuman (48.7%, a difference of 0.44%), and Lumbee (48.9%, a difference of 0.72%).
| Demographics | Rating | Rank | College, 1 year or more |
| Cape Verdeans | 0.0 /100 | #329 | Tragic 50.3% |
| Natives/Alaskans | 0.0 /100 | #330 | Tragic 50.2% |
| Immigrants | Yemen | 0.0 /100 | #331 | Tragic 50.0% |
| Mexicans | 0.0 /100 | #332 | Tragic 49.2% |
| Immigrants | Dominican Republic | 0.0 /100 | #333 | Tragic 49.1% |
| Lumbee | 0.0 /100 | #334 | Tragic 48.9% |
| Yuman | 0.0 /100 | #335 | Tragic 48.7% |
| Spanish American Indians | 0.0 /100 | #336 | Tragic 48.5% |
| Pennsylvania Germans | 0.0 /100 | #337 | Tragic 48.5% |
| Immigrants | Central America | 0.0 /100 | #338 | Tragic 48.5% |
| Immigrants | Azores | 0.0 /100 | #339 | Tragic 48.4% |
| Immigrants | Cabo Verde | 0.0 /100 | #340 | Tragic 48.1% |
| Immigrants | Mexico | 0.0 /100 | #341 | Tragic 47.5% |
| Inupiat | 0.0 /100 | #342 | Tragic 47.2% |
| Tohono O'odham | 0.0 /100 | #343 | Tragic 47.1% |
Demographics Similar to Immigrants from Norway by College, 1 year or more
In terms of college, 1 year or more, the demographic groups most similar to Immigrants from Norway are Immigrants from Russia (64.7%, a difference of 0.020%), Immigrants from Latvia (64.8%, a difference of 0.14%), Mongolian (64.8%, a difference of 0.15%), Immigrants from Lithuania (64.6%, a difference of 0.17%), and Bhutanese (64.6%, a difference of 0.18%).
| Demographics | Rating | Rank | College, 1 year or more |
| Russians | 99.9 /100 | #37 | Exceptional 65.1% |
| Immigrants | Saudi Arabia | 99.9 /100 | #38 | Exceptional 65.0% |
| Estonians | 99.9 /100 | #39 | Exceptional 65.0% |
| Immigrants | Kuwait | 99.9 /100 | #40 | Exceptional 65.0% |
| Mongolians | 99.9 /100 | #41 | Exceptional 64.8% |
| Immigrants | Latvia | 99.9 /100 | #42 | Exceptional 64.8% |
| Immigrants | Russia | 99.9 /100 | #43 | Exceptional 64.7% |
| Immigrants | Norway | 99.9 /100 | #44 | Exceptional 64.7% |
| Immigrants | Lithuania | 99.9 /100 | #45 | Exceptional 64.6% |
| Bhutanese | 99.9 /100 | #46 | Exceptional 64.6% |
| Australians | 99.9 /100 | #47 | Exceptional 64.6% |
| Immigrants | Bulgaria | 99.9 /100 | #48 | Exceptional 64.6% |
| New Zealanders | 99.9 /100 | #49 | Exceptional 64.6% |
| Immigrants | Austria | 99.8 /100 | #50 | Exceptional 64.4% |
| Immigrants | Malaysia | 99.8 /100 | #51 | Exceptional 64.3% |