Pueblo vs Immigrants from Norway College, 1 year or more
COMPARE
Pueblo
Immigrants from Norway
College, 1 year or more
College, 1 year or more Comparison
Pueblo
Immigrants from Norway
51.5%
COLLEGE, 1 YEAR OR MORE
0.0/ 100
METRIC RATING
312th/ 347
METRIC RANK
64.7%
COLLEGE, 1 YEAR OR MORE
99.9/ 100
METRIC RATING
44th/ 347
METRIC RANK
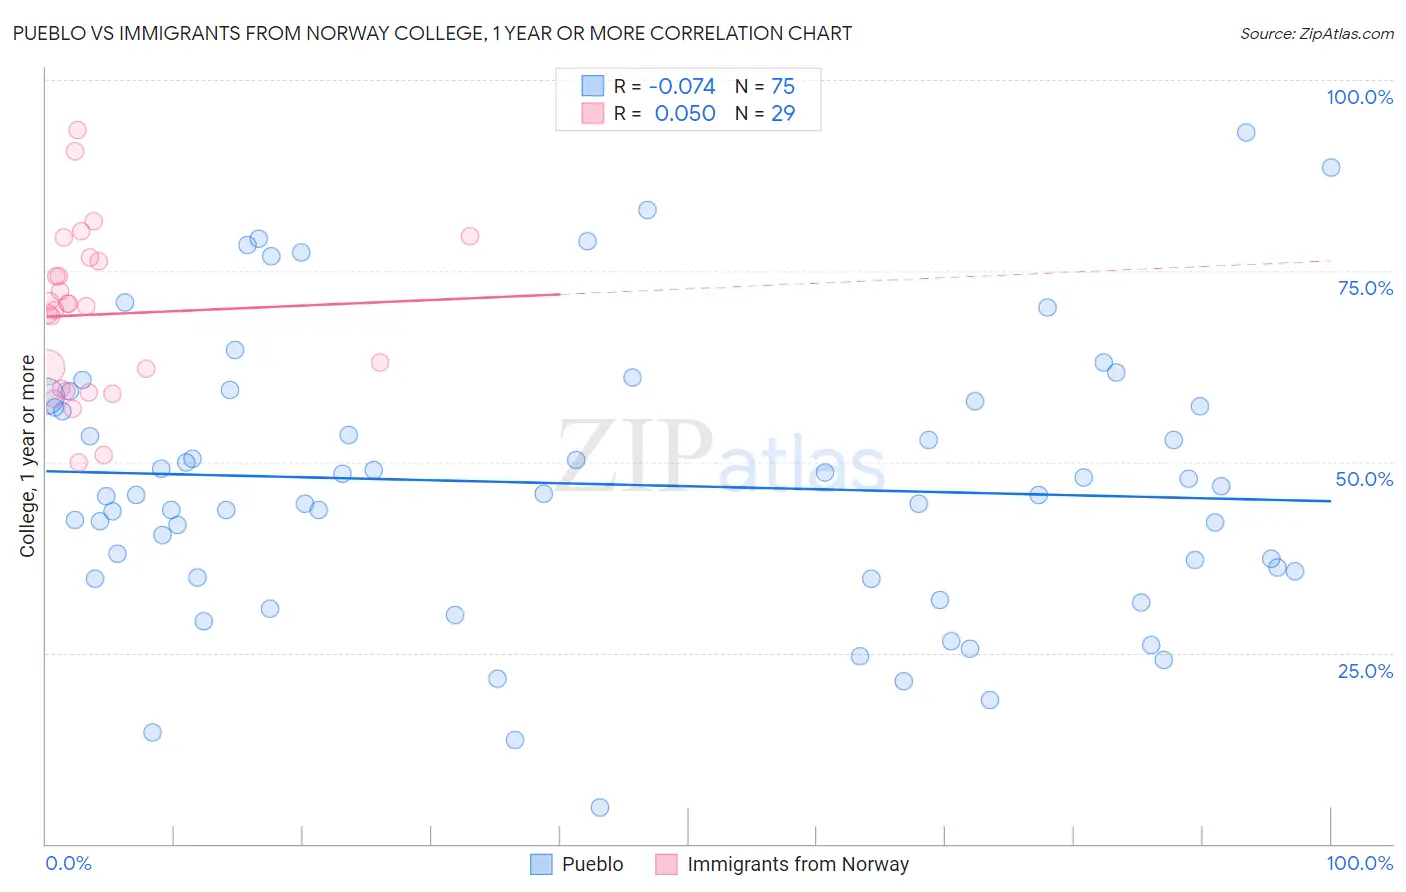
Pueblo vs Immigrants from Norway College, 1 year or more Correlation Chart
The statistical analysis conducted on geographies consisting of 120,087,269 people shows a slight negative correlation between the proportion of Pueblo and percentage of population with at least college, 1 year or more education in the United States with a correlation coefficient (R) of -0.074 and weighted average of 51.5%. Similarly, the statistical analysis conducted on geographies consisting of 116,716,420 people shows no correlation between the proportion of Immigrants from Norway and percentage of population with at least college, 1 year or more education in the United States with a correlation coefficient (R) of 0.050 and weighted average of 64.7%, a difference of 25.7%.
College, 1 year or more Correlation Summary
| Measurement | Pueblo | Immigrants from Norway |
| Minimum | 4.8% | 49.9% |
| Maximum | 93.1% | 93.5% |
| Range | 88.3% | 43.6% |
| Mean | 47.1% | 69.3% |
| Median | 45.6% | 70.3% |
| Interquartile 25% (IQ1) | 34.9% | 59.4% |
| Interquartile 75% (IQ3) | 57.9% | 76.5% |
| Interquartile Range (IQR) | 23.0% | 17.1% |
| Standard Deviation (Sample) | 18.1% | 10.7% |
| Standard Deviation (Population) | 18.0% | 10.6% |
Similar Demographics by College, 1 year or more
Demographics Similar to Pueblo by College, 1 year or more
In terms of college, 1 year or more, the demographic groups most similar to Pueblo are Immigrants from Haiti (51.5%, a difference of 0.040%), Immigrants from Caribbean (51.4%, a difference of 0.13%), Honduran (51.6%, a difference of 0.20%), Fijian (51.3%, a difference of 0.35%), and Guatemalan (51.2%, a difference of 0.58%).
| Demographics | Rating | Rank | College, 1 year or more |
| Seminole | 0.0 /100 | #305 | Tragic 52.1% |
| Mexican American Indians | 0.0 /100 | #306 | Tragic 51.9% |
| Immigrants | Portugal | 0.0 /100 | #307 | Tragic 51.9% |
| Salvadorans | 0.0 /100 | #308 | Tragic 51.8% |
| Apache | 0.0 /100 | #309 | Tragic 51.8% |
| Hondurans | 0.0 /100 | #310 | Tragic 51.6% |
| Immigrants | Haiti | 0.0 /100 | #311 | Tragic 51.5% |
| Pueblo | 0.0 /100 | #312 | Tragic 51.5% |
| Immigrants | Caribbean | 0.0 /100 | #313 | Tragic 51.4% |
| Fijians | 0.0 /100 | #314 | Tragic 51.3% |
| Guatemalans | 0.0 /100 | #315 | Tragic 51.2% |
| Cajuns | 0.0 /100 | #316 | Tragic 51.2% |
| Hispanics or Latinos | 0.0 /100 | #317 | Tragic 51.1% |
| Immigrants | Honduras | 0.0 /100 | #318 | Tragic 51.0% |
| Immigrants | El Salvador | 0.0 /100 | #319 | Tragic 51.0% |
Demographics Similar to Immigrants from Norway by College, 1 year or more
In terms of college, 1 year or more, the demographic groups most similar to Immigrants from Norway are Immigrants from Russia (64.7%, a difference of 0.020%), Immigrants from Latvia (64.8%, a difference of 0.14%), Mongolian (64.8%, a difference of 0.15%), Immigrants from Lithuania (64.6%, a difference of 0.17%), and Bhutanese (64.6%, a difference of 0.18%).
| Demographics | Rating | Rank | College, 1 year or more |
| Russians | 99.9 /100 | #37 | Exceptional 65.1% |
| Immigrants | Saudi Arabia | 99.9 /100 | #38 | Exceptional 65.0% |
| Estonians | 99.9 /100 | #39 | Exceptional 65.0% |
| Immigrants | Kuwait | 99.9 /100 | #40 | Exceptional 65.0% |
| Mongolians | 99.9 /100 | #41 | Exceptional 64.8% |
| Immigrants | Latvia | 99.9 /100 | #42 | Exceptional 64.8% |
| Immigrants | Russia | 99.9 /100 | #43 | Exceptional 64.7% |
| Immigrants | Norway | 99.9 /100 | #44 | Exceptional 64.7% |
| Immigrants | Lithuania | 99.9 /100 | #45 | Exceptional 64.6% |
| Bhutanese | 99.9 /100 | #46 | Exceptional 64.6% |
| Australians | 99.9 /100 | #47 | Exceptional 64.6% |
| Immigrants | Bulgaria | 99.9 /100 | #48 | Exceptional 64.6% |
| New Zealanders | 99.9 /100 | #49 | Exceptional 64.6% |
| Immigrants | Austria | 99.8 /100 | #50 | Exceptional 64.4% |
| Immigrants | Malaysia | 99.8 /100 | #51 | Exceptional 64.3% |