Immigrants from Guyana vs Immigrants from Norway College, 1 year or more

COMPARE

Immigrants from Guyana
Race
Ancestry
AfghanAfricanAlaska NativeAlaskan AthabascanAlbanianAleutAlsatianAmericanApacheArabArapahoArgentineanArmenianAssyrian/Chaldean/SyriacAustralianAustrianBahamianBangladeshiBarbadianBasqueBelgianBelizeanBermudanBhutaneseBlackfeetBolivianBrazilianBritishBritish West IndianBulgarianBurmeseCajunCambodianCanadianCape VerdeanCarpatho RusynCelticCentral AmericanCentral American IndianCherokeeCheyenneChickasawChileanChineseChippewaChoctawColombianColvilleComancheCosta RicanCreeCreekCroatianCrowCubanCypriotCzechCzechoslovakianDanishDelawareDominicanDutchDutch West IndianEastern EuropeanEcuadorianEgyptianEnglishEstonianEthiopianEuropeanFijianFilipinoFinnishFrenchFrench American IndianFrench CanadianGermanGerman RussianGhanaianGreekGuamanian/ChamorroGuatemalanGuyaneseHaitianHmongHonduranHopiHoumaHungarianIcelanderIndian (Asian)IndonesianInupiatIranianIraqiIrishIroquoisIsraeliItalianJamaicanJapaneseJordanianKenyanKiowaKoreanLaotianLatvianLebaneseLiberianLithuanianLumbeeLuxembourgerMacedonianMalaysianMalteseMarshalleseMenomineeMexicanMexican American IndianMongolianMoroccanNative HawaiianNavajoNepaleseNew ZealanderNicaraguanNigerianNorthern EuropeanNorwegianOkinawanOsageOttawaPaiutePakistaniPalestinianPanamanianParaguayanPennsylvania GermanPeruvianPimaPolishPortuguesePotawatomiPuebloPuerto RicanPuget Sound SalishRomanianRussianSalvadoranSamoanScandinavianScotch-IrishScottishSeminoleSenegaleseSerbianShoshoneSierra LeoneanSiouxSlavicSlovakSloveneSomaliSouth AfricanSouth AmericanSouth American IndianSoviet UnionSpaniardSpanishSpanish AmericanSpanish American IndianSri LankanSubsaharan AfricanSudaneseSwedishSwissSyrianTaiwaneseThaiTlingit-HaidaTohono O'OdhamTonganTrinidadian and TobagonianTsimshianTurkishU.S. Virgin IslanderUgandanUkrainianUruguayanUteVenezuelanVietnameseWelshWest IndianYakamaYaquiYugoslavianYumanYup'ikZimbabwean
Immigration
NonimmigrantsImmigrantsAfghanistanAfricaAlbaniaArgentinaArmeniaAsiaAustraliaAustriaBahamasBangladeshBarbadosBelarusBelgiumBelizeBoliviaBosnia and HerzegovinaBrazilBulgariaBurma/MyanmarCabo VerdeCambodiaCameroonCanadaCaribbeanCentral AmericaChileChinaColombiaCongoCosta RicaCroatiaCubaCzechoslovakiaDenmarkDominicaDominican RepublicEastern AfricaEastern AsiaEastern EuropeEcuadorEgyptEl SalvadorEnglandEritreaEthiopiaEuropeFijiFranceGermanyGhanaGreeceGrenadaGuatemalaGuyanaHaitiHondurasHong KongHungaryIndiaIndonesiaIranIraqIrelandIsraelItalyJamaicaJapanJordanKazakhstanKenyaKoreaKuwaitLaosLatin AmericaLatviaLebanonLiberiaLithuaniaMalaysiaMexicoMicronesiaMiddle AfricaMoldovaMoroccoNepalNetherlandsNicaraguaNigeriaNorth AmericaNorth MacedoniaNorthern AfricaNorthern EuropeOceaniaPakistanPanamaPeruPhilippinesPolandPortugalRomaniaRussiaSaudi ArabiaScotlandSenegalSerbiaSierra LeoneSingaporeSomaliaSouth AfricaSouth AmericaSouth Central AsiaSouth Eastern AsiaSouthern EuropeSpainSri LankaSt. Vincent and the GrenadinesSudanSwedenSwitzerlandSyriaTaiwanThailandTrinidad and TobagoTurkeyUgandaUkraineUruguayUzbekistanVenezuelaVietnamWest IndiesWestern AfricaWestern AsiaWestern EuropeYemenZaireZimbabweAzores
Immigrants from Norway
Race
Ancestry
AfghanAfricanAlaska NativeAlaskan AthabascanAlbanianAleutAlsatianAmericanApacheArabArapahoArgentineanArmenianAssyrian/Chaldean/SyriacAustralianAustrianBahamianBangladeshiBarbadianBasqueBelgianBelizeanBermudanBhutaneseBlackfeetBolivianBrazilianBritishBritish West IndianBulgarianBurmeseCajunCambodianCanadianCape VerdeanCarpatho RusynCelticCentral AmericanCentral American IndianCherokeeCheyenneChickasawChileanChineseChippewaChoctawColombianColvilleComancheCosta RicanCreeCreekCroatianCrowCubanCypriotCzechCzechoslovakianDanishDelawareDominicanDutchDutch West IndianEastern EuropeanEcuadorianEgyptianEnglishEstonianEthiopianEuropeanFijianFilipinoFinnishFrenchFrench American IndianFrench CanadianGermanGerman RussianGhanaianGreekGuamanian/ChamorroGuatemalanGuyaneseHaitianHmongHonduranHopiHoumaHungarianIcelanderIndian (Asian)IndonesianInupiatIranianIraqiIrishIroquoisIsraeliItalianJamaicanJapaneseJordanianKenyanKiowaKoreanLaotianLatvianLebaneseLiberianLithuanianLumbeeLuxembourgerMacedonianMalaysianMalteseMarshalleseMenomineeMexicanMexican American IndianMongolianMoroccanNative HawaiianNavajoNepaleseNew ZealanderNicaraguanNigerianNorthern EuropeanNorwegianOkinawanOsageOttawaPaiutePakistaniPalestinianPanamanianParaguayanPennsylvania GermanPeruvianPimaPolishPortuguesePotawatomiPuebloPuerto RicanPuget Sound SalishRomanianRussianSalvadoranSamoanScandinavianScotch-IrishScottishSeminoleSenegaleseSerbianShoshoneSierra LeoneanSiouxSlavicSlovakSloveneSomaliSouth AfricanSouth AmericanSouth American IndianSoviet UnionSpaniardSpanishSpanish AmericanSpanish American IndianSri LankanSubsaharan AfricanSudaneseSwedishSwissSyrianTaiwaneseThaiTlingit-HaidaTohono O'OdhamTonganTrinidadian and TobagonianTsimshianTurkishU.S. Virgin IslanderUgandanUkrainianUruguayanUteVenezuelanVietnameseWelshWest IndianYakamaYaquiYugoslavianYumanYup'ikZimbabwean
Immigration
NonimmigrantsImmigrantsAfghanistanAfricaAlbaniaArgentinaArmeniaAsiaAustraliaAustriaBahamasBangladeshBarbadosBelarusBelgiumBelizeBoliviaBosnia and HerzegovinaBrazilBulgariaBurma/MyanmarCabo VerdeCambodiaCameroonCanadaCaribbeanCentral AmericaChileChinaColombiaCongoCosta RicaCroatiaCubaCzechoslovakiaDenmarkDominicaDominican RepublicEastern AfricaEastern AsiaEastern EuropeEcuadorEgyptEl SalvadorEnglandEritreaEthiopiaEuropeFijiFranceGermanyGhanaGreeceGrenadaGuatemalaHaitiHondurasHong KongHungaryIndiaIndonesiaIranIraqIrelandIsraelItalyJamaicaJapanJordanKazakhstanKenyaKoreaKuwaitLaosLatin AmericaLatviaLebanonLiberiaLithuaniaMalaysiaMexicoMicronesiaMiddle AfricaMoldovaMoroccoNepalNetherlandsNicaraguaNigeriaNorth AmericaNorth MacedoniaNorthern AfricaNorthern EuropeNorwayOceaniaPakistanPanamaPeruPhilippinesPolandPortugalRomaniaRussiaSaudi ArabiaScotlandSenegalSerbiaSierra LeoneSingaporeSomaliaSouth AfricaSouth AmericaSouth Central AsiaSouth Eastern AsiaSouthern EuropeSpainSri LankaSt. Vincent and the GrenadinesSudanSwedenSwitzerlandSyriaTaiwanThailandTrinidad and TobagoTurkeyUgandaUkraineUruguayUzbekistanVenezuelaVietnamWest IndiesWestern AfricaWestern AsiaWestern EuropeYemenZaireZimbabweAzores
College, 1 year or more
Income
Poverty
Unemployment
Labor Participation
Family Structure
Vehicle Availability
Education Level
Disability

College, 1 year or more Comparison

Immigrants from Guyana

Immigrants from Norway

Tragic
Exceptional
53.5%
COLLEGE, 1 YEAR OR MORE
0.1/ 100
METRIC RATING
285th/ 347
METRIC RANK
64.7%
COLLEGE, 1 YEAR OR MORE
99.9/ 100
METRIC RATING
44th/ 347
METRIC RANK

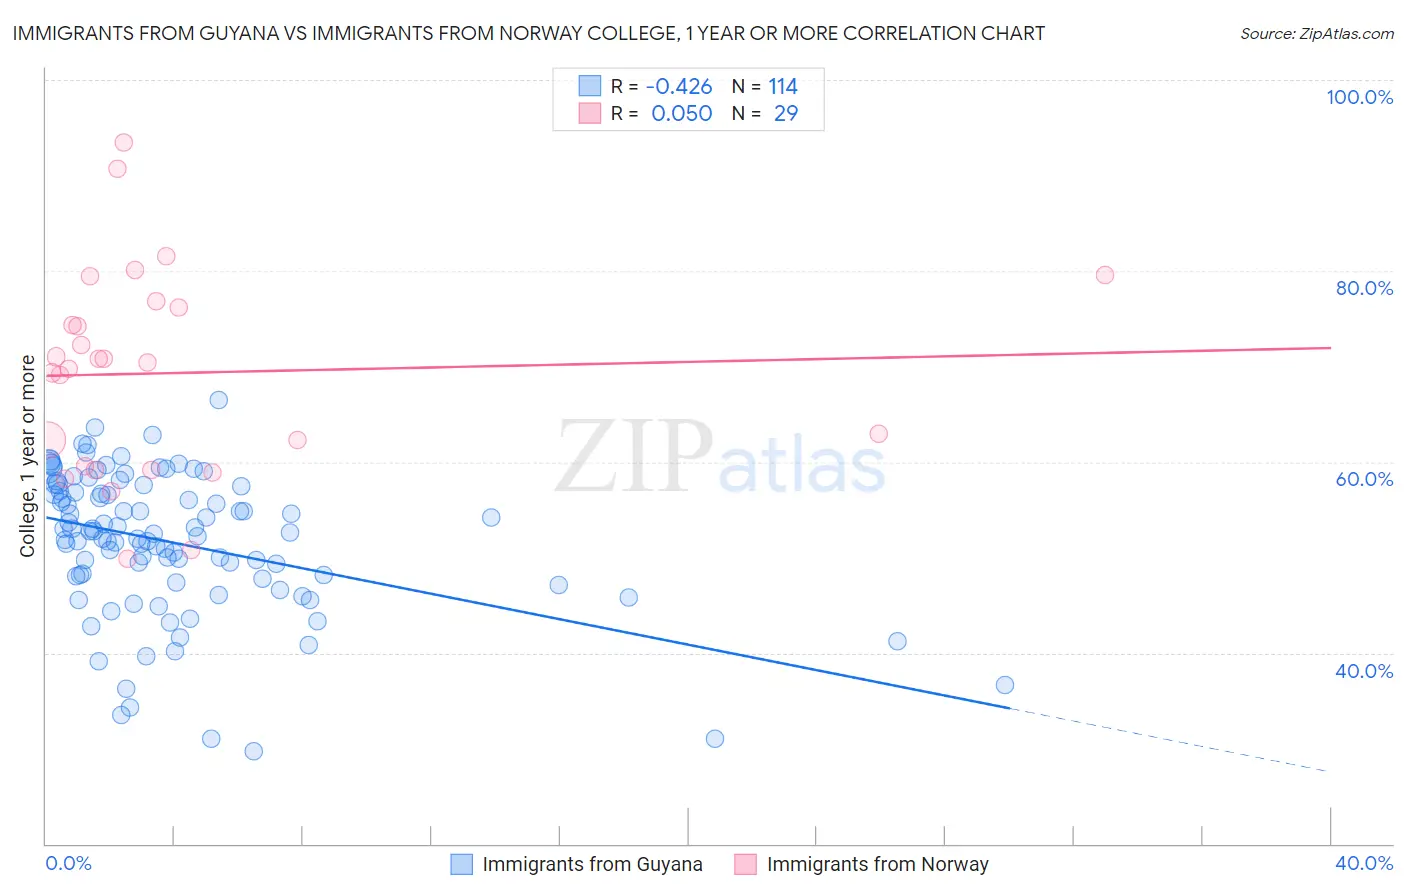
Immigrants from Guyana vs Immigrants from Norway College, 1 year or more Correlation Chart

The statistical analysis conducted on geographies consisting of 183,735,121 people shows a moderate negative correlation between the proportion of Immigrants from Guyana and percentage of population with at least college, 1 year or more education in the United States with a correlation coefficient (R) of -0.426 and weighted average of 53.5%. Similarly, the statistical analysis conducted on geographies consisting of 116,716,420 people shows no correlation between the proportion of Immigrants from Norway and percentage of population with at least college, 1 year or more education in the United States with a correlation coefficient (R) of 0.050 and weighted average of 64.7%, a difference of 20.9%.
Immigrants from Guyana vs Immigrants from Norway College, 1 year or more

College, 1 year or more Correlation Summary

MeasurementImmigrants from GuyanaImmigrants from Norway
Minimum29.6%49.9%
Maximum66.5%93.5%
Range36.8%43.6%
Mean51.5%69.3%
Median52.6%70.3%
Interquartile 25% (IQ1)47.8%59.4%
Interquartile 75% (IQ3)57.0%76.5%
Interquartile Range (IQR)9.2%17.1%
Standard Deviation (Sample)7.4%10.7%
Standard Deviation (Population)7.4%10.6%

Similar Demographics by College, 1 year or more

Demographics Similar to Immigrants from Guyana by College, 1 year or more

In terms of college, 1 year or more, the demographic groups most similar to Immigrants from Guyana are Central American Indian (53.5%, a difference of 0.040%), Immigrants from Belize (53.5%, a difference of 0.080%), Alaska Native (53.4%, a difference of 0.25%), Immigrants from Ecuador (53.4%, a difference of 0.25%), and Alaskan Athabascan (53.4%, a difference of 0.27%).
DemographicsRating | RankCollege, 1 year or more
Immigrants | Jamaica
0.1
/100
|
#278
Tragic
54.2%
Arapaho
0.1
/100
|
#279
Tragic
54.1%
Cheyenne
0.1
/100
|
#280
Tragic
54.1%
Colville
0.1
/100
|
#281
Tragic
54.1%
Guyanese
0.1
/100
|
#282
Tragic
54.1%
Nicaraguans
0.1
/100
|
#283
Tragic
53.9%
Ute
0.1
/100
|
#284
Tragic
53.8%
Immigrants | Guyana
0.1
/100
|
#285
Tragic
53.5%
Central American Indians
0.1
/100
|
#286
Tragic
53.5%
Immigrants | Belize
0.1
/100
|
#287
Tragic
53.5%
Alaska Natives
0.0
/100
|
#288
Tragic
53.4%
Immigrants | Ecuador
0.0
/100
|
#289
Tragic
53.4%
Alaskan Athabascans
0.0
/100
|
#290
Tragic
53.4%
Cubans
0.0
/100
|
#291
Tragic
53.4%
Chickasaw
0.0
/100
|
#292
Tragic
53.3%

Demographics Similar to Immigrants from Norway by College, 1 year or more

In terms of college, 1 year or more, the demographic groups most similar to Immigrants from Norway are Immigrants from Russia (64.7%, a difference of 0.020%), Immigrants from Latvia (64.8%, a difference of 0.14%), Mongolian (64.8%, a difference of 0.15%), Immigrants from Lithuania (64.6%, a difference of 0.17%), and Bhutanese (64.6%, a difference of 0.18%).
DemographicsRating | RankCollege, 1 year or more
Russians
99.9
/100
|
#37
Exceptional
65.1%
Immigrants | Saudi Arabia
99.9
/100
|
#38
Exceptional
65.0%
Estonians
99.9
/100
|
#39
Exceptional
65.0%
Immigrants | Kuwait
99.9
/100
|
#40
Exceptional
65.0%
Mongolians
99.9
/100
|
#41
Exceptional
64.8%
Immigrants | Latvia
99.9
/100
|
#42
Exceptional
64.8%
Immigrants | Russia
99.9
/100
|
#43
Exceptional
64.7%
Immigrants | Norway
99.9
/100
|
#44
Exceptional
64.7%
Immigrants | Lithuania
99.9
/100
|
#45
Exceptional
64.6%
Bhutanese
99.9
/100
|
#46
Exceptional
64.6%
Australians
99.9
/100
|
#47
Exceptional
64.6%
Immigrants | Bulgaria
99.9
/100
|
#48
Exceptional
64.6%
New Zealanders
99.9
/100
|
#49
Exceptional
64.6%
Immigrants | Austria
99.8
/100
|
#50
Exceptional
64.4%
Immigrants | Malaysia
99.8
/100
|
#51
Exceptional
64.3%