Immigrants from Uruguay vs Welsh College, Under 1 year
COMPARE
Immigrants from Uruguay
Welsh
College, Under 1 year
College, Under 1 year Comparison
Immigrants from Uruguay
Welsh
63.4%
COLLEGE, UNDER 1 YEAR
5.8/ 100
METRIC RATING
217th/ 347
METRIC RANK
66.0%
COLLEGE, UNDER 1 YEAR
69.9/ 100
METRIC RATING
156th/ 347
METRIC RANK
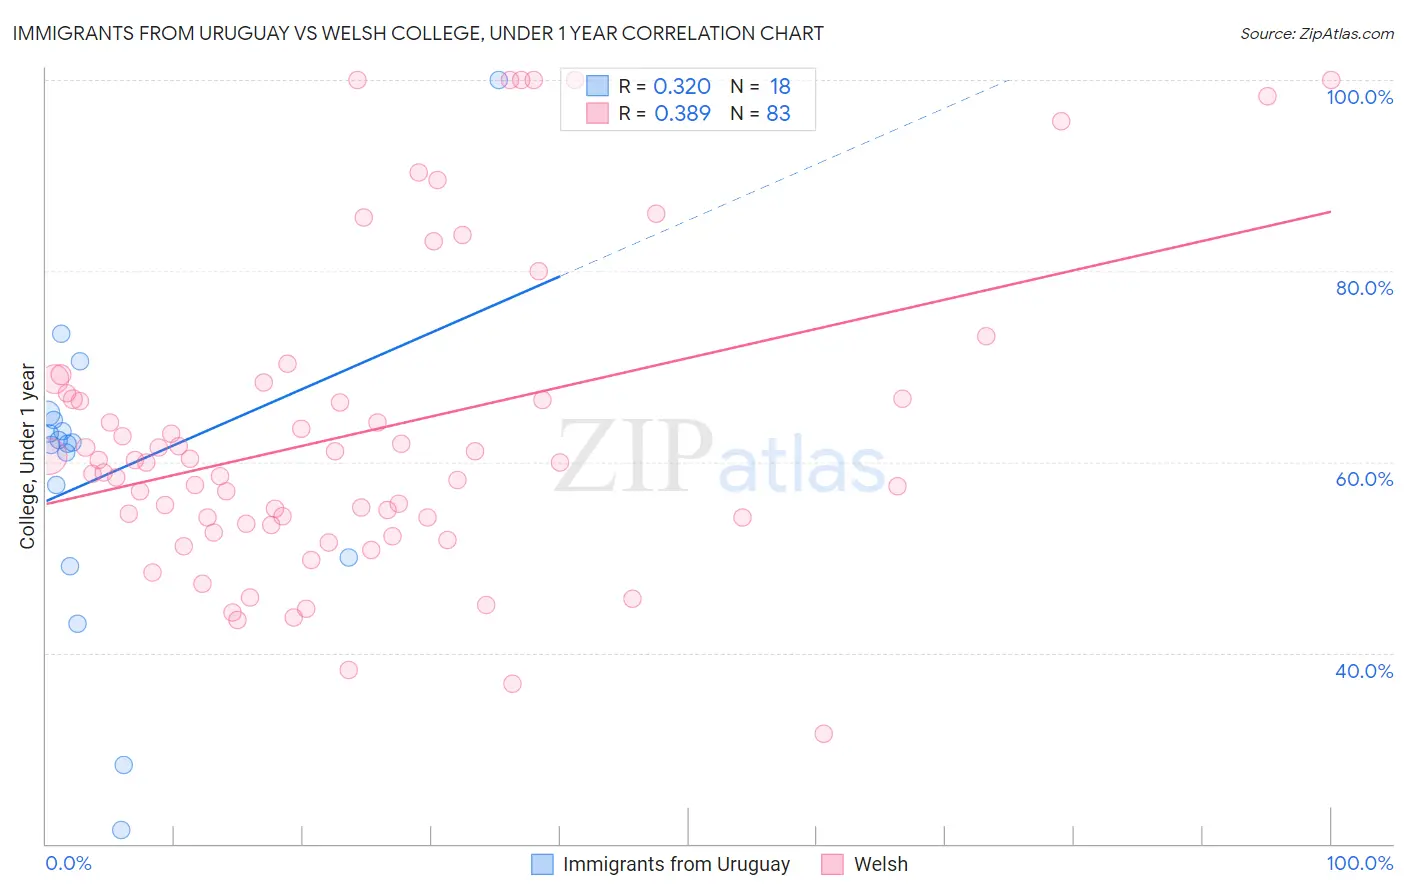
Immigrants from Uruguay vs Welsh College, Under 1 year Correlation Chart
The statistical analysis conducted on geographies consisting of 133,259,667 people shows a mild positive correlation between the proportion of Immigrants from Uruguay and percentage of population with at least college, under 1 year education in the United States with a correlation coefficient (R) of 0.320 and weighted average of 63.4%. Similarly, the statistical analysis conducted on geographies consisting of 528,593,935 people shows a mild positive correlation between the proportion of Welsh and percentage of population with at least college, under 1 year education in the United States with a correlation coefficient (R) of 0.389 and weighted average of 66.0%, a difference of 4.1%.
College, Under 1 year Correlation Summary
| Measurement | Immigrants from Uruguay | Welsh |
| Minimum | 21.5% | 31.6% |
| Maximum | 100.0% | 100.0% |
| Range | 78.5% | 68.4% |
| Mean | 58.8% | 63.1% |
| Median | 62.0% | 60.0% |
| Interquartile 25% (IQ1) | 50.0% | 53.5% |
| Interquartile 75% (IQ3) | 64.4% | 67.2% |
| Interquartile Range (IQR) | 14.4% | 13.7% |
| Standard Deviation (Sample) | 17.1% | 16.3% |
| Standard Deviation (Population) | 16.6% | 16.2% |
Similar Demographics by College, Under 1 year
Demographics Similar to Immigrants from Uruguay by College, Under 1 year
In terms of college, under 1 year, the demographic groups most similar to Immigrants from Uruguay are Immigrants from Panama (63.4%, a difference of 0.020%), Immigrants from Fiji (63.4%, a difference of 0.030%), Portuguese (63.4%, a difference of 0.050%), Cree (63.3%, a difference of 0.14%), and Hmong (63.5%, a difference of 0.19%).
| Demographics | Rating | Rank | College, Under 1 year |
| Ghanaians | 11.2 /100 | #210 | Poor 63.9% |
| Native Hawaiians | 10.6 /100 | #211 | Poor 63.9% |
| Immigrants | Middle Africa | 10.5 /100 | #212 | Poor 63.9% |
| Immigrants | South America | 9.1 /100 | #213 | Tragic 63.8% |
| Immigrants | Nigeria | 8.8 /100 | #214 | Tragic 63.7% |
| Senegalese | 7.7 /100 | #215 | Tragic 63.6% |
| Hmong | 6.8 /100 | #216 | Tragic 63.5% |
| Immigrants | Uruguay | 5.8 /100 | #217 | Tragic 63.4% |
| Immigrants | Panama | 5.7 /100 | #218 | Tragic 63.4% |
| Immigrants | Fiji | 5.7 /100 | #219 | Tragic 63.4% |
| Portuguese | 5.6 /100 | #220 | Tragic 63.4% |
| Cree | 5.2 /100 | #221 | Tragic 63.3% |
| Immigrants | Senegal | 5.0 /100 | #222 | Tragic 63.3% |
| Immigrants | Costa Rica | 4.5 /100 | #223 | Tragic 63.2% |
| Sub-Saharan Africans | 4.4 /100 | #224 | Tragic 63.2% |
Demographics Similar to Welsh by College, Under 1 year
In terms of college, under 1 year, the demographic groups most similar to Welsh are Irish (66.0%, a difference of 0.020%), Sierra Leonean (66.0%, a difference of 0.10%), Immigrants from Eritrea (66.1%, a difference of 0.11%), Celtic (65.9%, a difference of 0.13%), and Tlingit-Haida (65.9%, a difference of 0.18%).
| Demographics | Rating | Rank | College, Under 1 year |
| Immigrants | Venezuela | 77.9 /100 | #149 | Good 66.3% |
| Immigrants | Iraq | 77.1 /100 | #150 | Good 66.3% |
| Immigrants | Sudan | 76.0 /100 | #151 | Good 66.2% |
| Sudanese | 74.1 /100 | #152 | Good 66.2% |
| Belgians | 73.7 /100 | #153 | Good 66.2% |
| Immigrants | Eritrea | 71.9 /100 | #154 | Good 66.1% |
| Irish | 70.3 /100 | #155 | Good 66.0% |
| Welsh | 69.9 /100 | #156 | Good 66.0% |
| Sierra Leoneans | 67.8 /100 | #157 | Good 66.0% |
| Celtics | 67.3 /100 | #158 | Good 65.9% |
| Tlingit-Haida | 66.4 /100 | #159 | Good 65.9% |
| Albanians | 66.1 /100 | #160 | Good 65.9% |
| Brazilians | 66.0 /100 | #161 | Good 65.9% |
| Koreans | 65.3 /100 | #162 | Good 65.9% |
| Somalis | 62.7 /100 | #163 | Good 65.8% |