Immigrants from Micronesia vs Immigrants from Zaire Unemployment
COMPARE
Immigrants from Micronesia
Immigrants from Zaire
Unemployment
Unemployment Comparison
Immigrants from Micronesia
Immigrants from Zaire
5.3%
UNEMPLOYMENT
25.2/ 100
METRIC RATING
203rd/ 347
METRIC RANK
5.2%
UNEMPLOYMENT
64.7/ 100
METRIC RATING
163rd/ 347
METRIC RANK
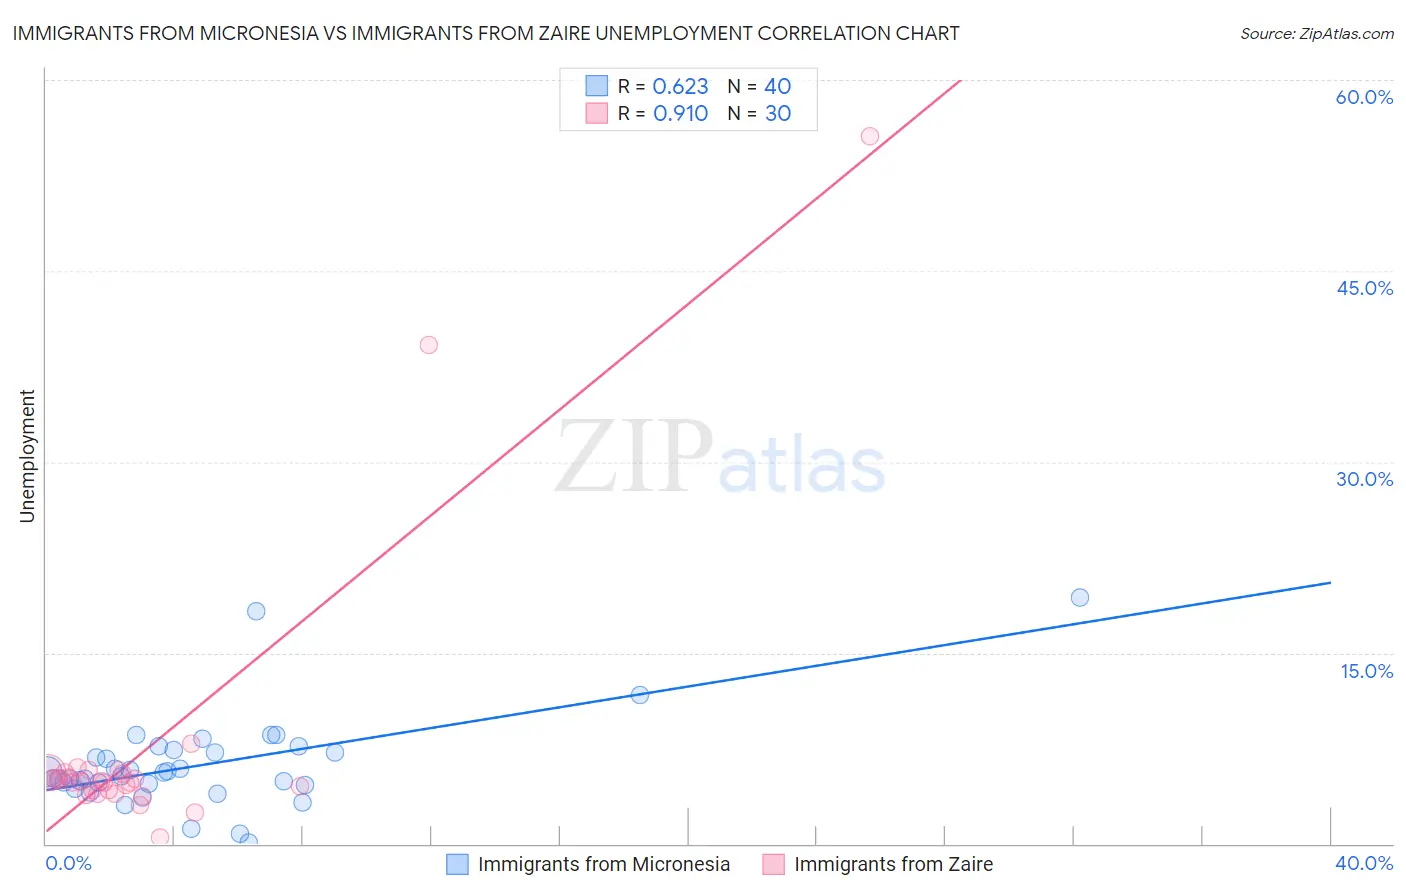
Immigrants from Micronesia vs Immigrants from Zaire Unemployment Correlation Chart
The statistical analysis conducted on geographies consisting of 61,596,499 people shows a significant positive correlation between the proportion of Immigrants from Micronesia and unemployment in the United States with a correlation coefficient (R) of 0.623 and weighted average of 5.3%. Similarly, the statistical analysis conducted on geographies consisting of 107,241,303 people shows a near-perfect positive correlation between the proportion of Immigrants from Zaire and unemployment in the United States with a correlation coefficient (R) of 0.910 and weighted average of 5.2%, a difference of 2.6%.
Unemployment Correlation Summary
| Measurement | Immigrants from Micronesia | Immigrants from Zaire |
| Minimum | 0.10% | 0.50% |
| Maximum | 19.3% | 55.6% |
| Range | 19.2% | 55.1% |
| Mean | 6.2% | 7.5% |
| Median | 5.4% | 4.9% |
| Interquartile 25% (IQ1) | 4.6% | 4.2% |
| Interquartile 75% (IQ3) | 7.3% | 5.6% |
| Interquartile Range (IQR) | 2.6% | 1.4% |
| Standard Deviation (Sample) | 3.7% | 11.1% |
| Standard Deviation (Population) | 3.6% | 10.9% |
Similar Demographics by Unemployment
Demographics Similar to Immigrants from Micronesia by Unemployment
In terms of unemployment, the demographic groups most similar to Immigrants from Micronesia are Cherokee (5.3%, a difference of 0.030%), Immigrants from Ukraine (5.3%, a difference of 0.030%), Native Hawaiian (5.3%, a difference of 0.080%), Immigrants from South Eastern Asia (5.3%, a difference of 0.14%), and Korean (5.3%, a difference of 0.17%).
| Demographics | Rating | Rank | Unemployment |
| Peruvians | 29.9 /100 | #196 | Fair 5.3% |
| Immigrants | Uruguay | 29.8 /100 | #197 | Fair 5.3% |
| Immigrants | Israel | 28.6 /100 | #198 | Fair 5.3% |
| Immigrants | Afghanistan | 28.6 /100 | #199 | Fair 5.3% |
| Koreans | 27.4 /100 | #200 | Fair 5.3% |
| Immigrants | South Eastern Asia | 27.0 /100 | #201 | Fair 5.3% |
| Cherokee | 25.5 /100 | #202 | Fair 5.3% |
| Immigrants | Micronesia | 25.2 /100 | #203 | Fair 5.3% |
| Immigrants | Ukraine | 24.9 /100 | #204 | Fair 5.3% |
| Native Hawaiians | 24.1 /100 | #205 | Fair 5.3% |
| Immigrants | Peru | 22.7 /100 | #206 | Fair 5.4% |
| Creek | 19.4 /100 | #207 | Poor 5.4% |
| Portuguese | 19.0 /100 | #208 | Poor 5.4% |
| Immigrants | Iran | 18.8 /100 | #209 | Poor 5.4% |
| Immigrants | Iraq | 18.6 /100 | #210 | Poor 5.4% |
Demographics Similar to Immigrants from Zaire by Unemployment
In terms of unemployment, the demographic groups most similar to Immigrants from Zaire are Immigrants from Colombia (5.2%, a difference of 0.0%), Spanish (5.2%, a difference of 0.020%), Immigrants from Oceania (5.2%, a difference of 0.030%), Laotian (5.2%, a difference of 0.11%), and Immigrants from Brazil (5.2%, a difference of 0.11%).
| Demographics | Rating | Rank | Unemployment |
| Immigrants | Kazakhstan | 70.4 /100 | #156 | Good 5.2% |
| Sri Lankans | 69.5 /100 | #157 | Good 5.2% |
| Immigrants | Egypt | 66.7 /100 | #158 | Good 5.2% |
| Immigrants | Russia | 66.6 /100 | #159 | Good 5.2% |
| Laotians | 66.3 /100 | #160 | Good 5.2% |
| Immigrants | Oceania | 65.2 /100 | #161 | Good 5.2% |
| Spanish | 65.1 /100 | #162 | Good 5.2% |
| Immigrants | Zaire | 64.7 /100 | #163 | Good 5.2% |
| Immigrants | Colombia | 64.7 /100 | #164 | Good 5.2% |
| Immigrants | Brazil | 63.1 /100 | #165 | Good 5.2% |
| Immigrants | Indonesia | 61.2 /100 | #166 | Good 5.2% |
| Colombians | 61.1 /100 | #167 | Good 5.2% |
| Uruguayans | 60.2 /100 | #168 | Good 5.2% |
| Immigrants | Morocco | 59.1 /100 | #169 | Average 5.2% |
| Immigrants | Nicaragua | 57.1 /100 | #170 | Average 5.2% |